| __timestamp | Analog Devices, Inc. | Cisco Systems, Inc. |
|---|---|---|
| Wednesday, January 1, 2014 | 1034585000 | 19373000000 |
| Thursday, January 1, 2015 | 1175830000 | 19480000000 |
| Friday, January 1, 2016 | 1194236000 | 18287000000 |
| Sunday, January 1, 2017 | 2045907000 | 17781000000 |
| Monday, January 1, 2018 | 1967640000 | 18724000000 |
| Tuesday, January 1, 2019 | 1977315000 | 19238000000 |
| Wednesday, January 1, 2020 | 1912578000 | 17618000000 |
| Friday, January 1, 2021 | 2793274000 | 17924000000 |
| Saturday, January 1, 2022 | 4481479000 | 19309000000 |
| Sunday, January 1, 2023 | 4428321000 | 21245000000 |
| Monday, January 1, 2024 | 4045814000 | 18975000000 |
Igniting the spark of knowledge
In the ever-evolving tech industry, cost efficiency is a critical metric for success. Over the past decade, Cisco Systems, Inc. and Analog Devices, Inc. have demonstrated contrasting trends in their cost of revenue. From 2014 to 2023, Cisco's cost of revenue has remained relatively stable, averaging around $19 billion annually, with a slight increase of about 10% by 2023. In contrast, Analog Devices has seen a dramatic rise, with costs more than quadrupling from approximately $1 billion in 2014 to over $4 billion in 2023.
This divergence highlights Cisco's consistent operational efficiency, while Analog Devices' increase may reflect strategic investments or scaling challenges. As the tech landscape continues to shift, these trends offer valuable insights into each company's financial strategies and market positioning. Investors and industry analysts should watch these developments closely as they could signal future growth trajectories.
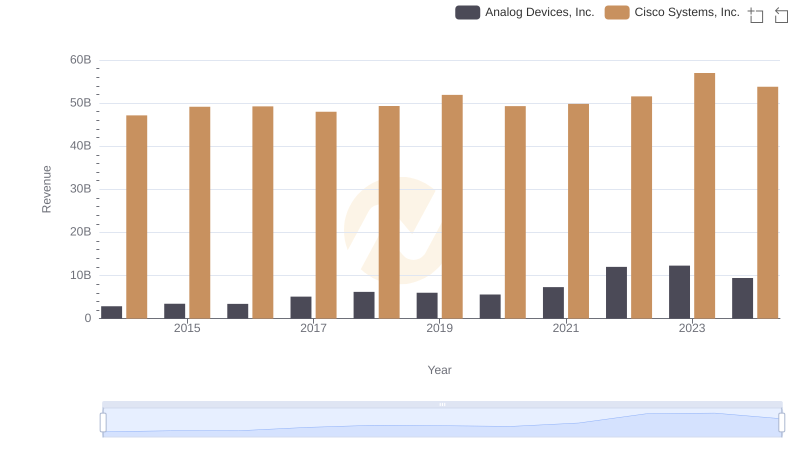
Cisco Systems, Inc. and Analog Devices, Inc.: A Comprehensive Revenue Analysis
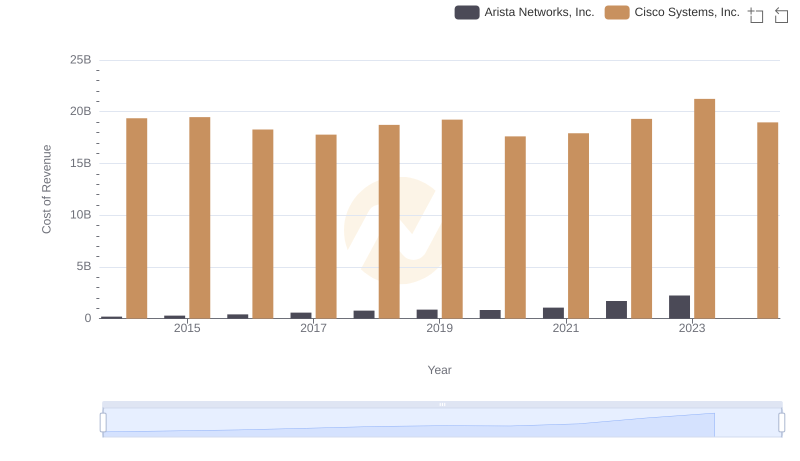
Analyzing Cost of Revenue: Cisco Systems, Inc. and Arista Networks, Inc.
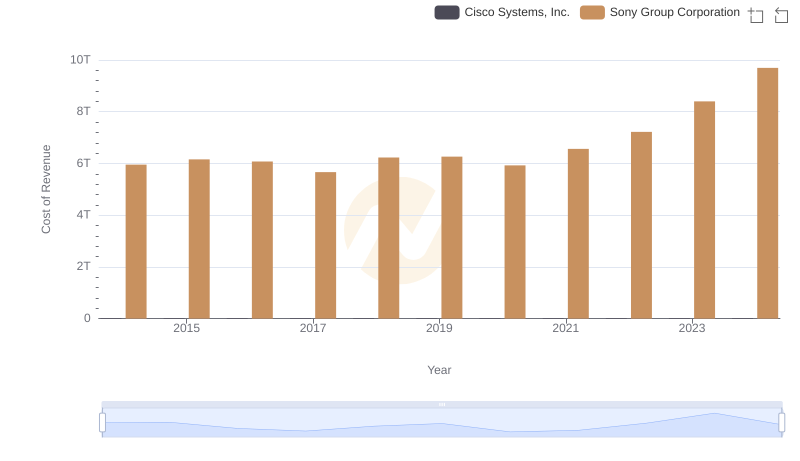
Cisco Systems, Inc. vs Sony Group Corporation: Efficiency in Cost of Revenue Explored

Cost of Revenue Trends: Cisco Systems, Inc. vs Palo Alto Networks, Inc.
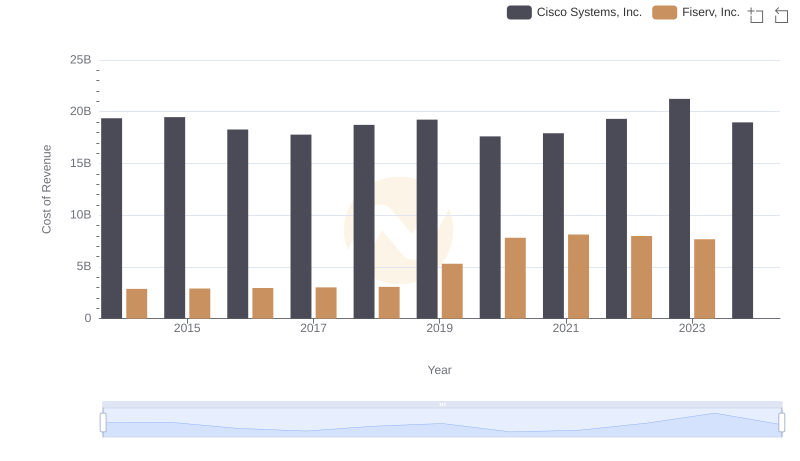
Cost of Revenue Comparison: Cisco Systems, Inc. vs Fiserv, Inc.
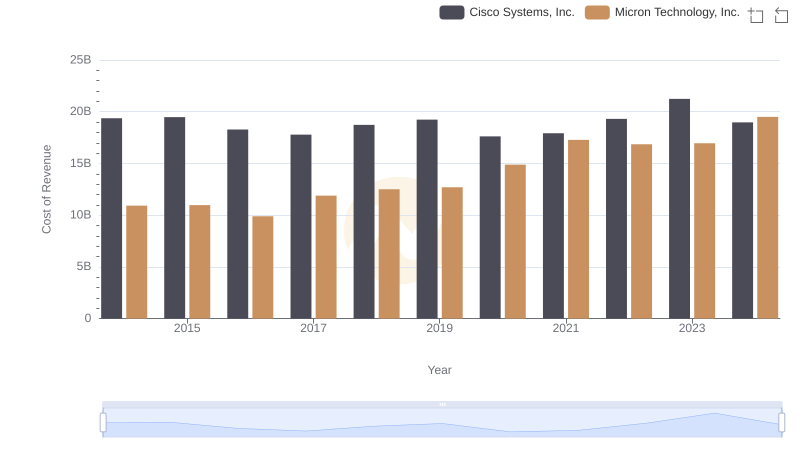
Analyzing Cost of Revenue: Cisco Systems, Inc. and Micron Technology, Inc.
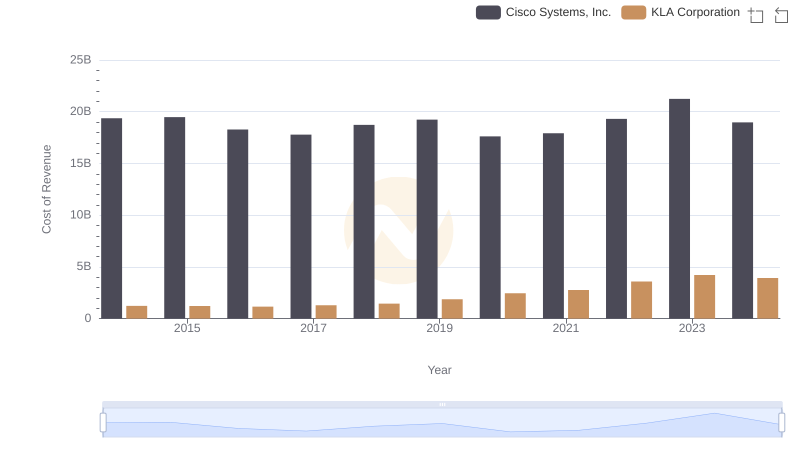
Cisco Systems, Inc. vs KLA Corporation: Efficiency in Cost of Revenue Explored
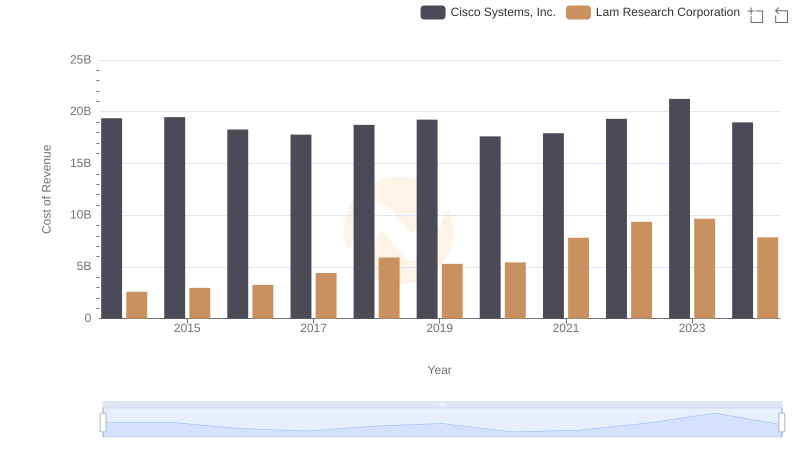
Analyzing Cost of Revenue: Cisco Systems, Inc. and Lam Research Corporation
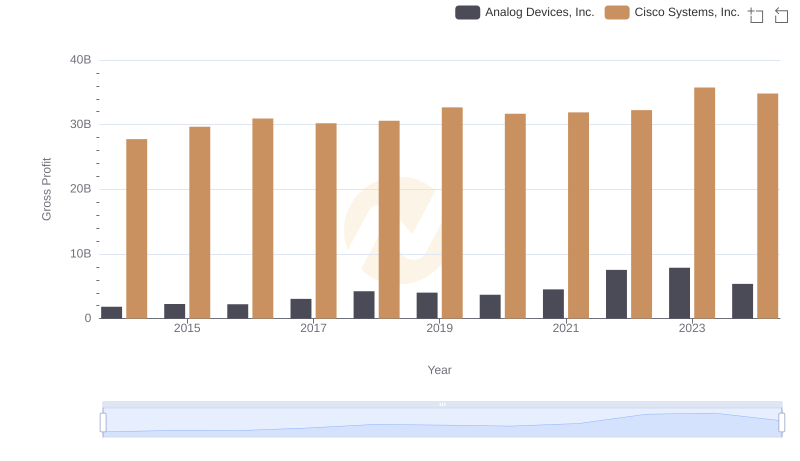
Gross Profit Analysis: Comparing Cisco Systems, Inc. and Analog Devices, Inc.
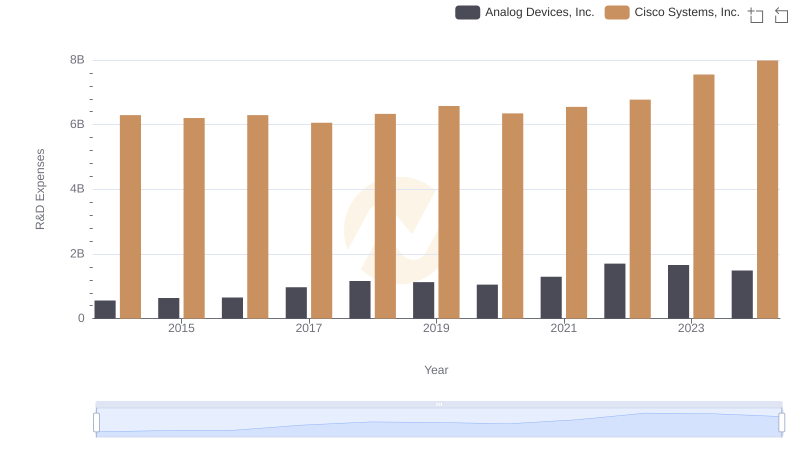
Cisco Systems, Inc. or Analog Devices, Inc.: Who Invests More in Innovation?
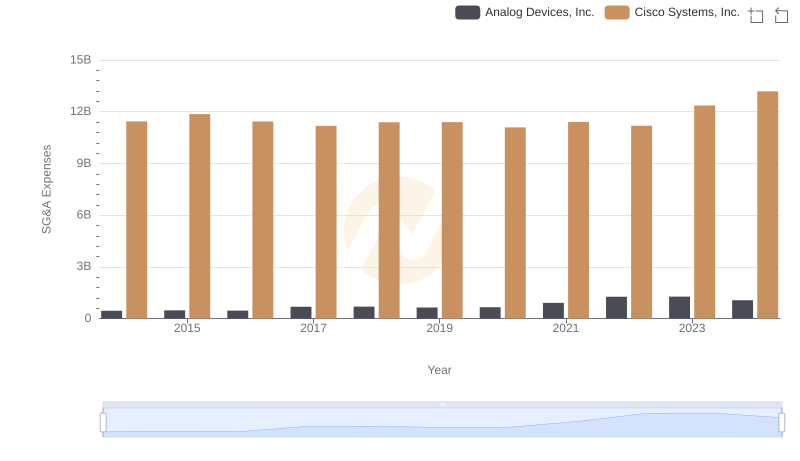
Cisco Systems, Inc. vs Analog Devices, Inc.: SG&A Expense Trends
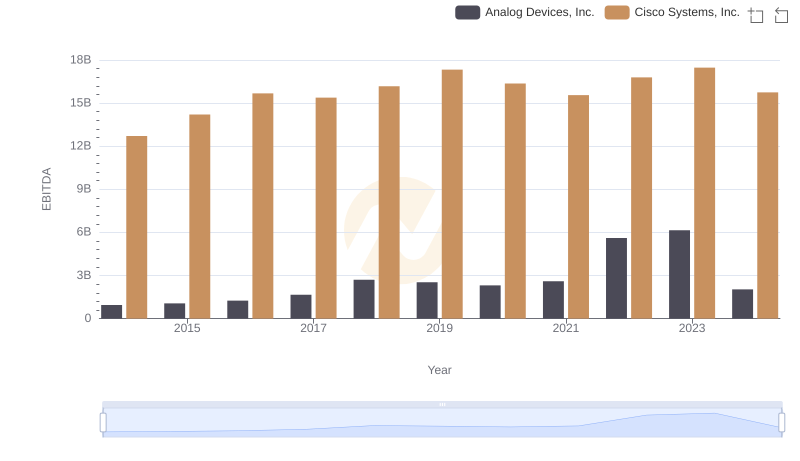
Cisco Systems, Inc. vs Analog Devices, Inc.: In-Depth EBITDA Performance Comparison