| __timestamp | Cisco Systems, Inc. | Micron Technology, Inc. |
|---|---|---|
| Wednesday, January 1, 2014 | 19373000000 | 10921000000 |
| Thursday, January 1, 2015 | 19480000000 | 10977000000 |
| Friday, January 1, 2016 | 18287000000 | 9894000000 |
| Sunday, January 1, 2017 | 17781000000 | 11886000000 |
| Monday, January 1, 2018 | 18724000000 | 12500000000 |
| Tuesday, January 1, 2019 | 19238000000 | 12704000000 |
| Wednesday, January 1, 2020 | 17618000000 | 14883000000 |
| Friday, January 1, 2021 | 17924000000 | 17282000000 |
| Saturday, January 1, 2022 | 19309000000 | 16860000000 |
| Sunday, January 1, 2023 | 21245000000 | 16956000000 |
| Monday, January 1, 2024 | 18975000000 | 19498000000 |
Unleashing the power of data
In the ever-evolving landscape of technology, understanding the cost dynamics of industry giants like Cisco Systems, Inc. and Micron Technology, Inc. is crucial. Over the past decade, from 2014 to 2024, Cisco's cost of revenue has shown a steady trend, peaking in 2023 with a 10% increase from its 2014 figures. Meanwhile, Micron Technology has experienced a more volatile journey, with a notable 78% surge in 2024 compared to its 2014 baseline.
This data highlights the contrasting strategies of these tech titans. Cisco's consistent cost management reflects its stable market position, while Micron's fluctuations suggest a more aggressive growth strategy, possibly driven by the dynamic semiconductor market. As we move forward, these trends offer valuable insights into the operational efficiencies and market strategies of these leading companies.
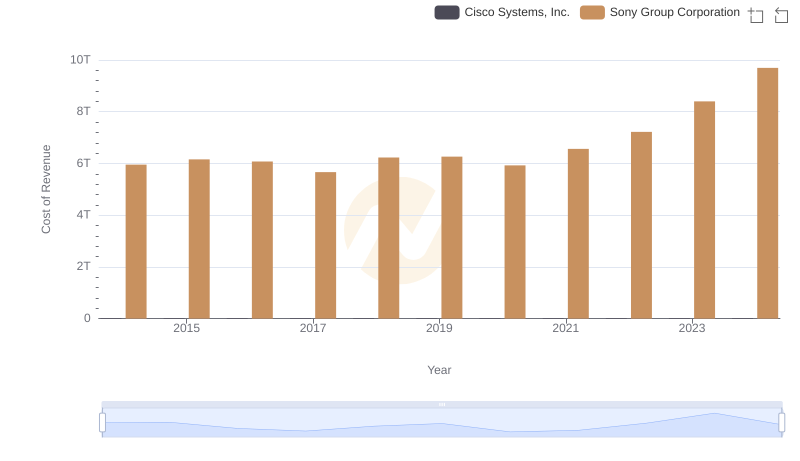
Cisco Systems, Inc. vs Sony Group Corporation: Efficiency in Cost of Revenue Explored
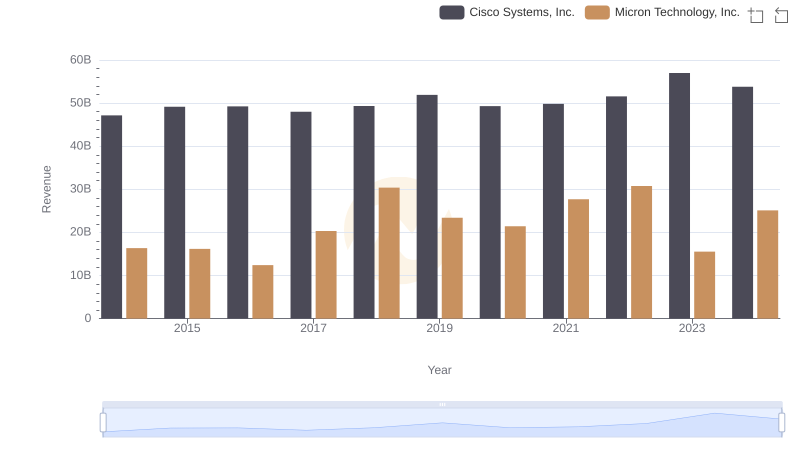
Cisco Systems, Inc. or Micron Technology, Inc.: Who Leads in Yearly Revenue?

Cost of Revenue Trends: Cisco Systems, Inc. vs Palo Alto Networks, Inc.
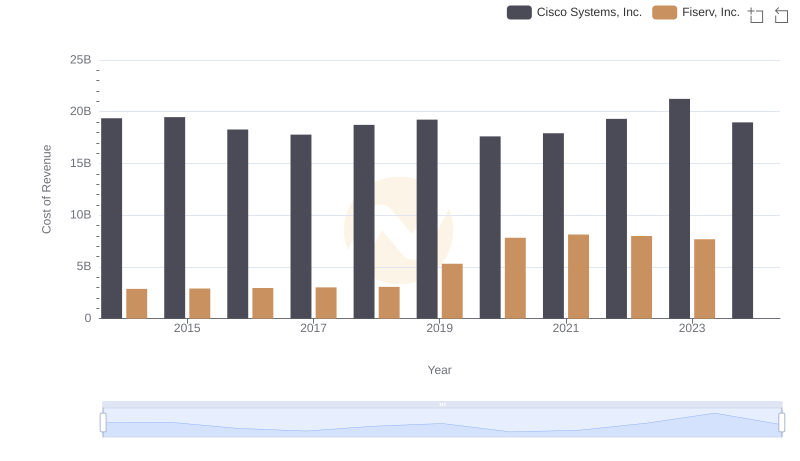
Cost of Revenue Comparison: Cisco Systems, Inc. vs Fiserv, Inc.
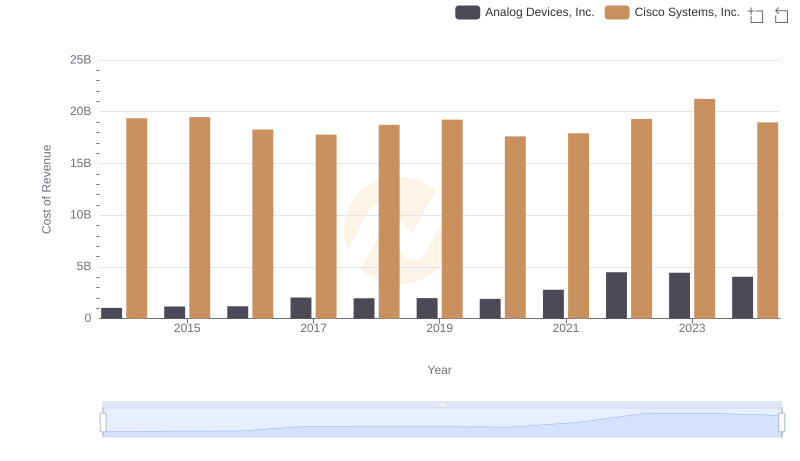
Comparing Cost of Revenue Efficiency: Cisco Systems, Inc. vs Analog Devices, Inc.
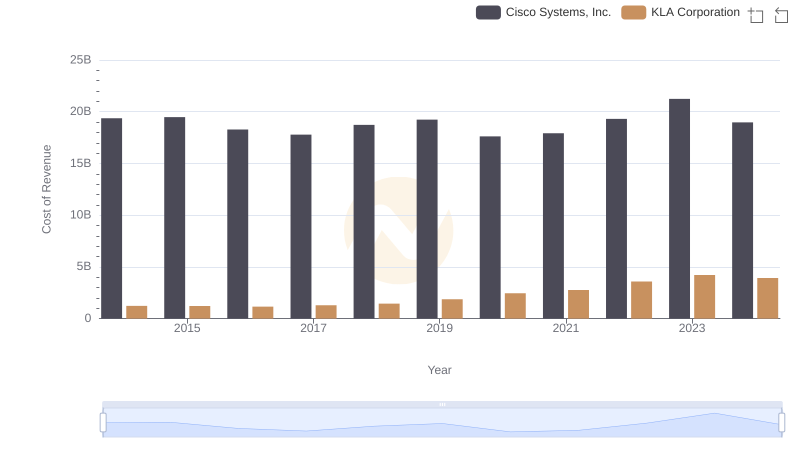
Cisco Systems, Inc. vs KLA Corporation: Efficiency in Cost of Revenue Explored
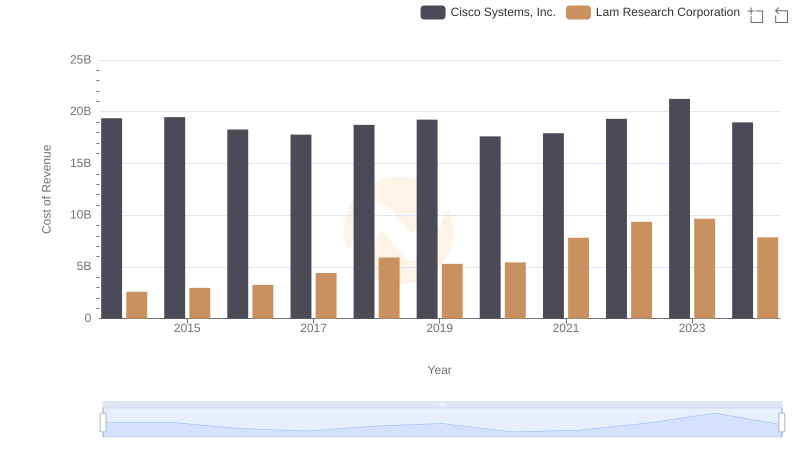
Analyzing Cost of Revenue: Cisco Systems, Inc. and Lam Research Corporation
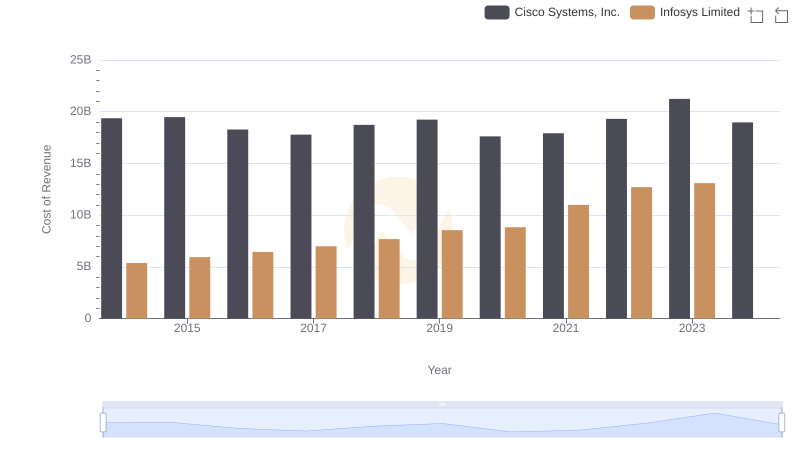
Cost of Revenue: Key Insights for Cisco Systems, Inc. and Infosys Limited
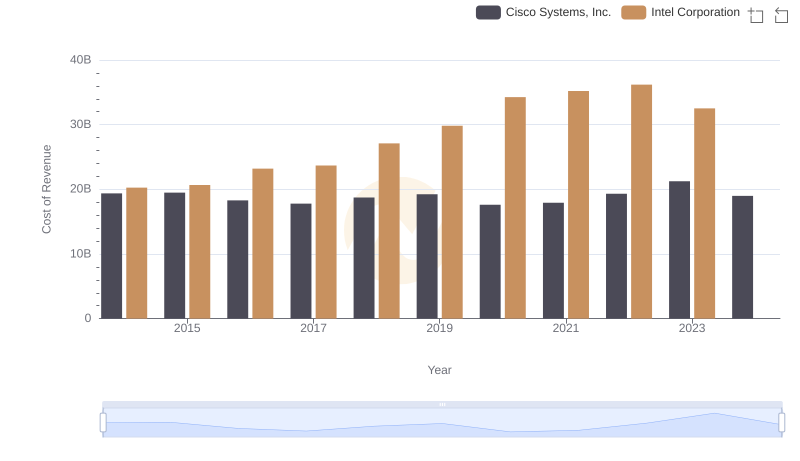
Comparing Cost of Revenue Efficiency: Cisco Systems, Inc. vs Intel Corporation
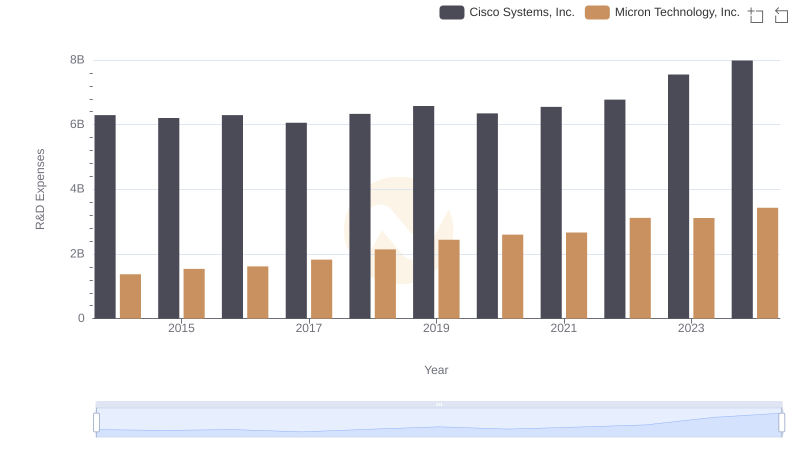
Who Prioritizes Innovation? R&D Spending Compared for Cisco Systems, Inc. and Micron Technology, Inc.
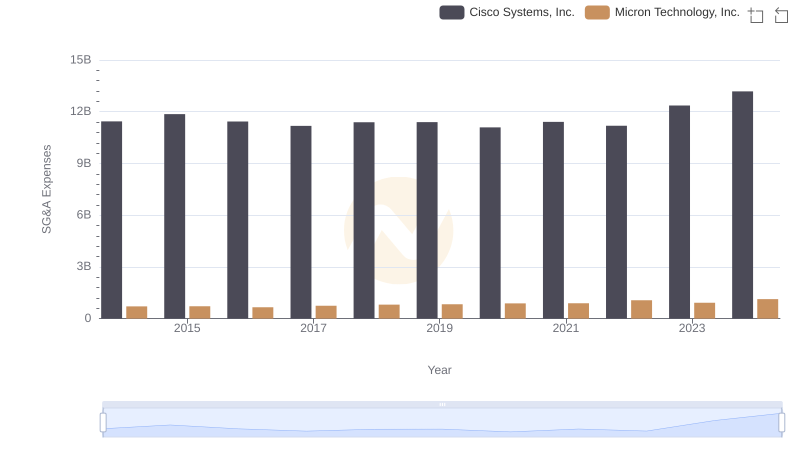
Cisco Systems, Inc. and Micron Technology, Inc.: SG&A Spending Patterns Compared
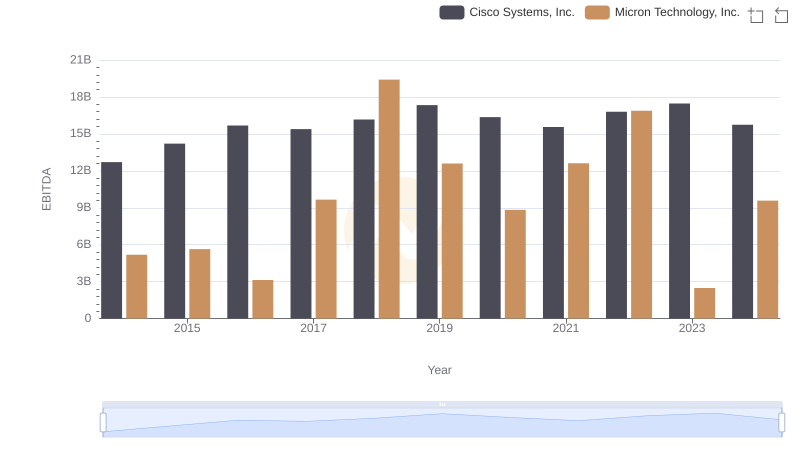
A Side-by-Side Analysis of EBITDA: Cisco Systems, Inc. and Micron Technology, Inc.