| __timestamp | Cisco Systems, Inc. | Sony Group Corporation |
|---|---|---|
| Wednesday, January 1, 2014 | 12709000000 | 711569000000 |
| Thursday, January 1, 2015 | 14209000000 | 690894000000 |
| Friday, January 1, 2016 | 15678000000 | 1026468000000 |
| Sunday, January 1, 2017 | 15383000000 | 890716000000 |
| Monday, January 1, 2018 | 16172000000 | 1433333000000 |
| Tuesday, January 1, 2019 | 17334000000 | 1746634000000 |
| Wednesday, January 1, 2020 | 16363000000 | 1556991000000 |
| Friday, January 1, 2021 | 15558000000 | 1637322000000 |
| Saturday, January 1, 2022 | 16794000000 | 2056876000000 |
| Sunday, January 1, 2023 | 17471000000 | 2305484000000 |
| Monday, January 1, 2024 | 15747000000 | 2454639000000 |
Cracking the code
In the ever-evolving landscape of global technology, Cisco Systems, Inc. and Sony Group Corporation stand as titans, each with a unique trajectory. From 2014 to 2024, Cisco's EBITDA has shown a steady growth of approximately 38%, peaking in 2023. Meanwhile, Sony's EBITDA has skyrocketed by over 240% during the same period, reflecting its dynamic expansion in the entertainment and electronics sectors.
Cisco's EBITDA journey is marked by stability, with a notable increase in 2019, reaching its highest in 2023. This growth underscores Cisco's robust networking solutions and strategic acquisitions.
Sony's EBITDA narrative is one of remarkable ascent, particularly from 2018 onwards, driven by its leadership in gaming and entertainment. By 2024, Sony's EBITDA is nearly 14 times that of Cisco, highlighting its diversified portfolio and global reach.
Explore the chart to witness this fascinating financial duel.
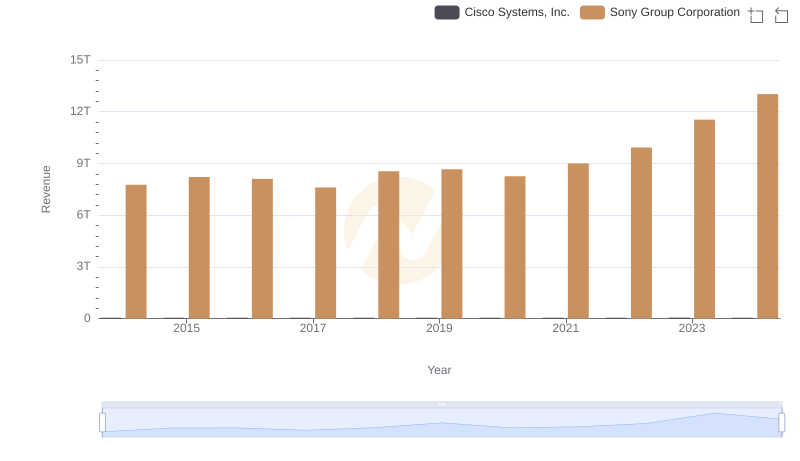
Breaking Down Revenue Trends: Cisco Systems, Inc. vs Sony Group Corporation
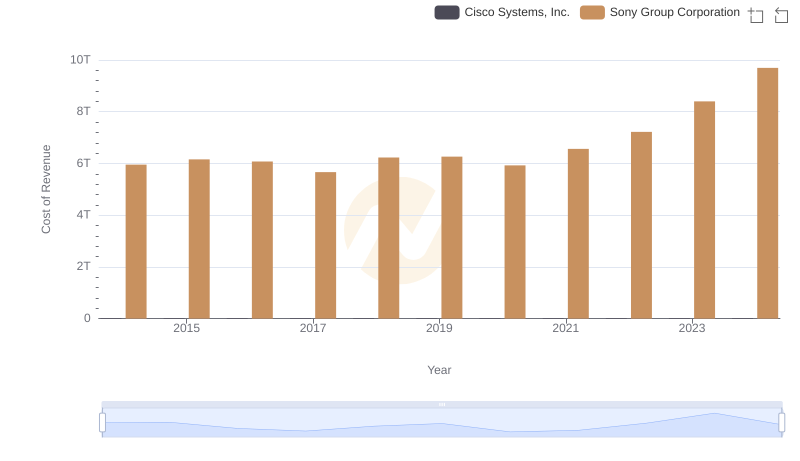
Cisco Systems, Inc. vs Sony Group Corporation: Efficiency in Cost of Revenue Explored
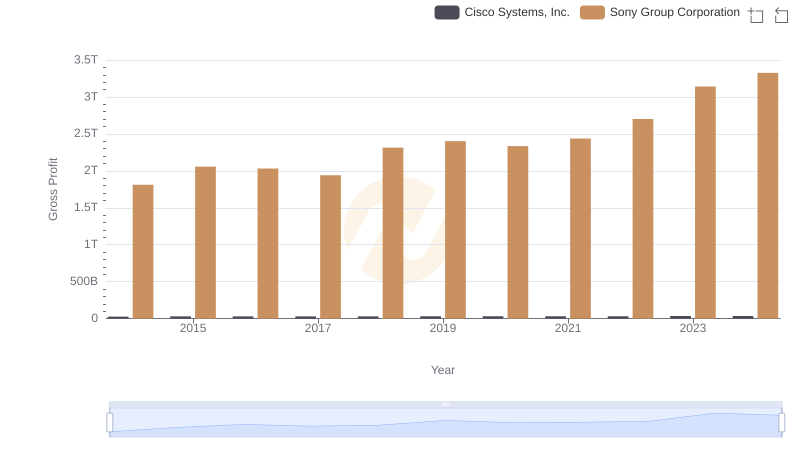
Who Generates Higher Gross Profit? Cisco Systems, Inc. or Sony Group Corporation
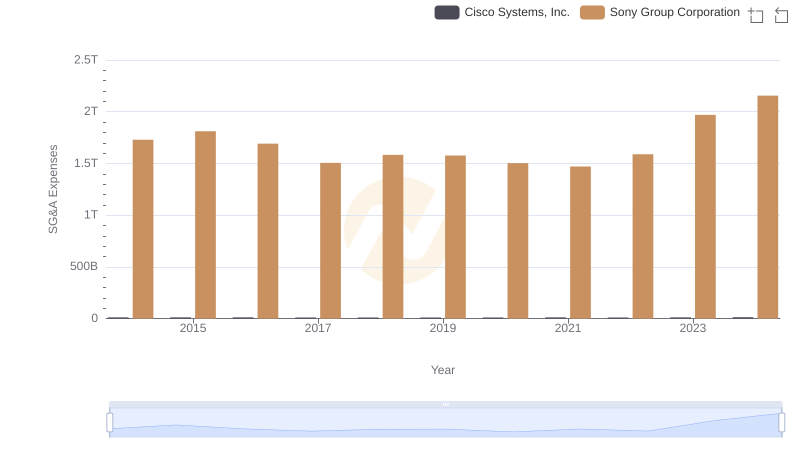
Comparing SG&A Expenses: Cisco Systems, Inc. vs Sony Group Corporation Trends and Insights
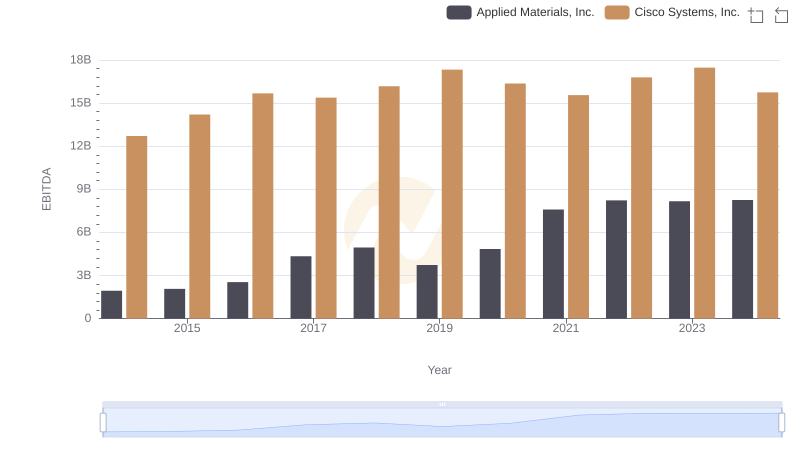
EBITDA Performance Review: Cisco Systems, Inc. vs Applied Materials, Inc.
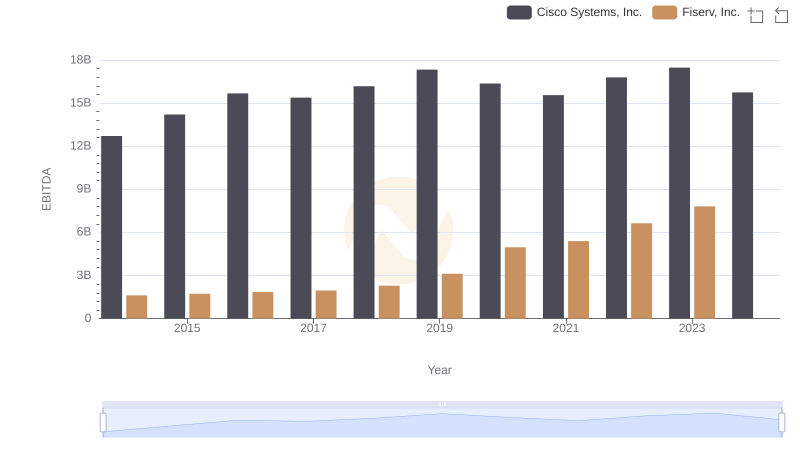
EBITDA Analysis: Evaluating Cisco Systems, Inc. Against Fiserv, Inc.
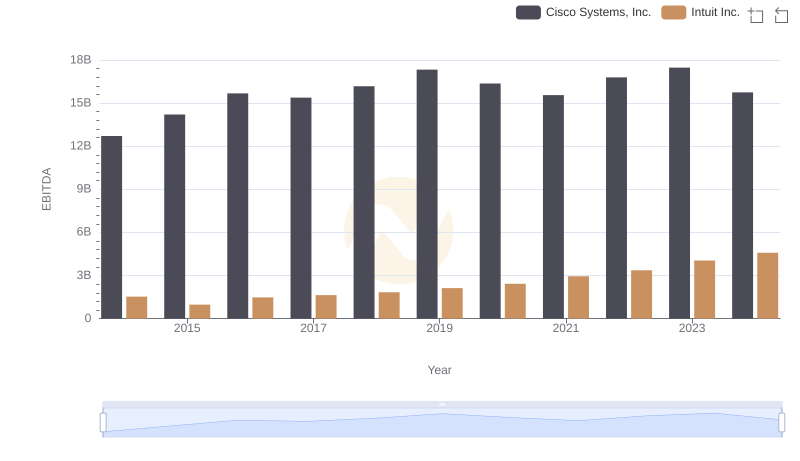
Cisco Systems, Inc. vs Intuit Inc.: In-Depth EBITDA Performance Comparison
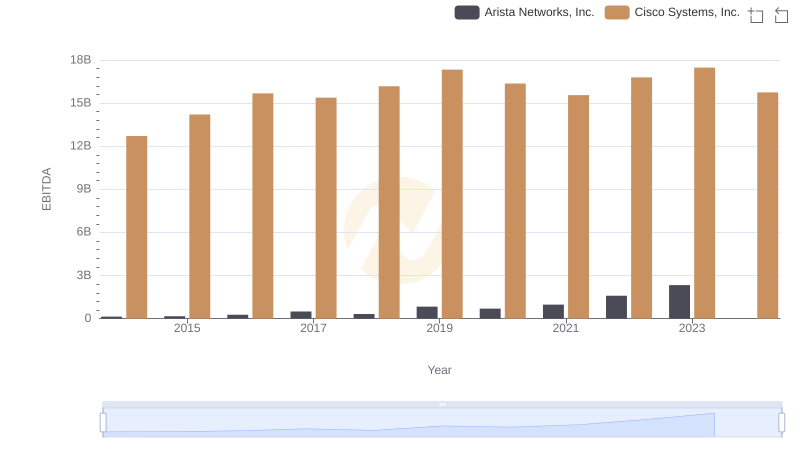
A Professional Review of EBITDA: Cisco Systems, Inc. Compared to Arista Networks, Inc.

A Professional Review of EBITDA: Cisco Systems, Inc. Compared to Fiserv, Inc.
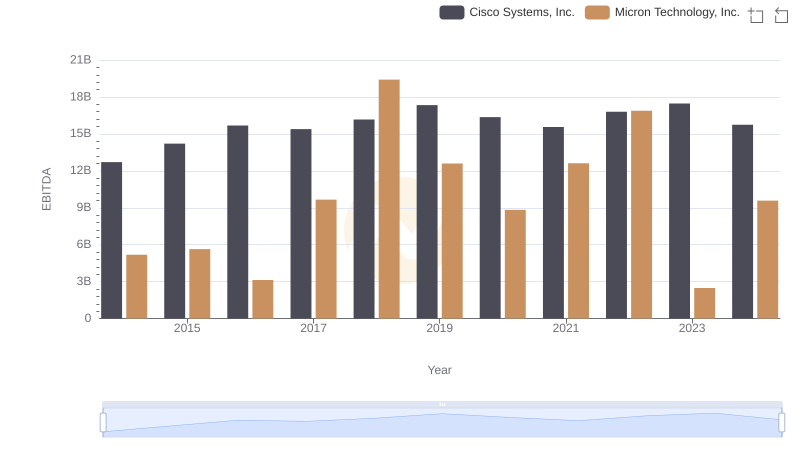
A Side-by-Side Analysis of EBITDA: Cisco Systems, Inc. and Micron Technology, Inc.
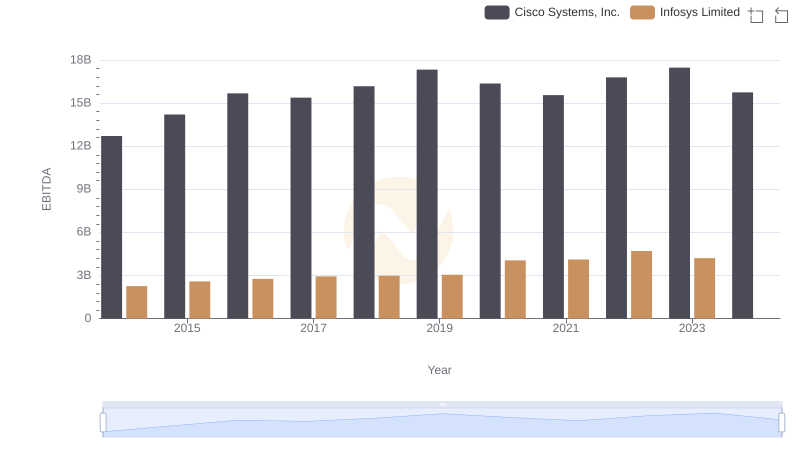
Professional EBITDA Benchmarking: Cisco Systems, Inc. vs Infosys Limited
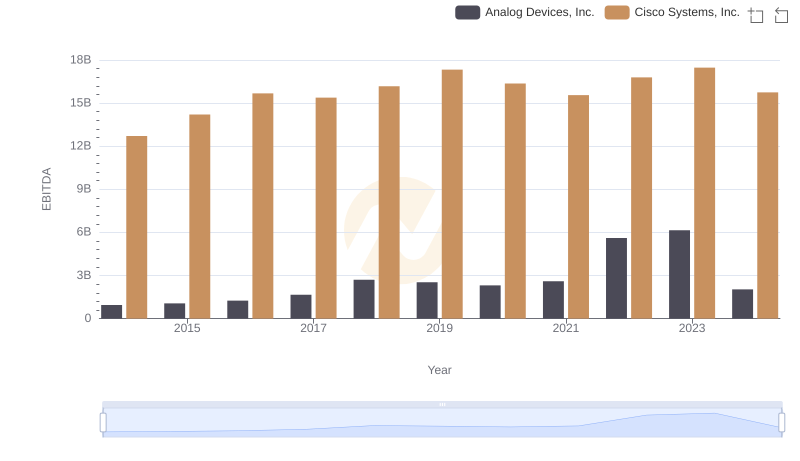
Cisco Systems, Inc. vs Analog Devices, Inc.: In-Depth EBITDA Performance Comparison