| __timestamp | Cisco Systems, Inc. | Sony Group Corporation |
|---|---|---|
| Wednesday, January 1, 2014 | 11437000000 | 1728520000000 |
| Thursday, January 1, 2015 | 11861000000 | 1811461000000 |
| Friday, January 1, 2016 | 11433000000 | 1691930000000 |
| Sunday, January 1, 2017 | 11177000000 | 1505956000000 |
| Monday, January 1, 2018 | 11386000000 | 1583197000000 |
| Tuesday, January 1, 2019 | 11398000000 | 1576825000000 |
| Wednesday, January 1, 2020 | 11094000000 | 1502625000000 |
| Friday, January 1, 2021 | 11411000000 | 1469955000000 |
| Saturday, January 1, 2022 | 11186000000 | 1588473000000 |
| Sunday, January 1, 2023 | 12358000000 | 1969170000000 |
| Monday, January 1, 2024 | 13177000000 | 2156156000000 |
Igniting the spark of knowledge
In the ever-evolving landscape of global business, understanding the financial strategies of industry leaders is crucial. This analysis delves into the Selling, General, and Administrative (SG&A) expenses of two titans: Cisco Systems, Inc. and Sony Group Corporation, from 2014 to 2024.
Cisco's SG&A expenses have shown a steady increase, peaking in 2024 with a 15% rise from 2014. This reflects Cisco's strategic investments in marketing and administrative efficiencies. Meanwhile, Sony's SG&A expenses have surged by nearly 25% over the same period, indicating a robust expansion strategy and increased operational costs.
The data reveals a fascinating contrast: while both companies have increased their SG&A spending, Sony's growth trajectory is more pronounced. This could suggest a more aggressive market positioning or a response to competitive pressures. As these giants continue to evolve, their financial strategies offer valuable insights into their future directions.
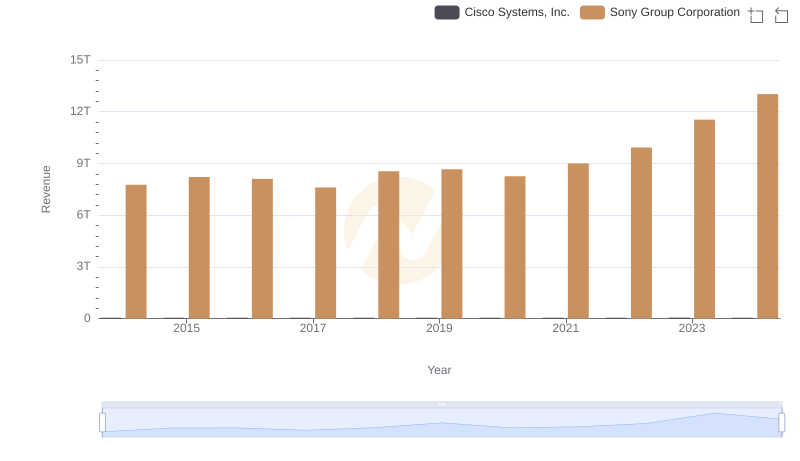
Breaking Down Revenue Trends: Cisco Systems, Inc. vs Sony Group Corporation
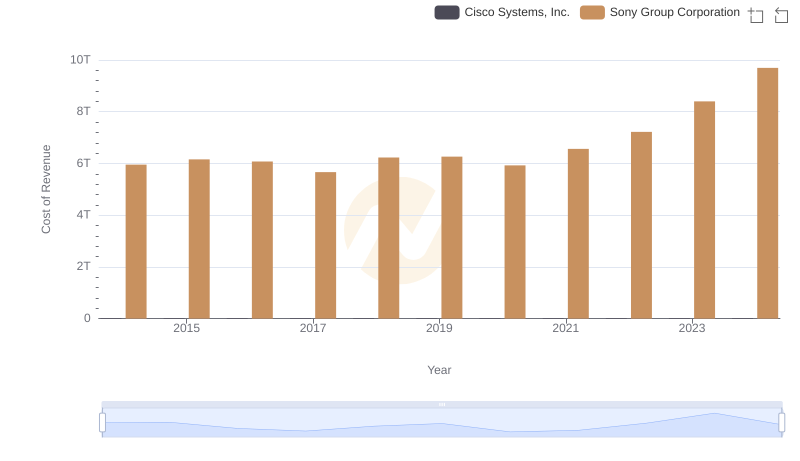
Cisco Systems, Inc. vs Sony Group Corporation: Efficiency in Cost of Revenue Explored
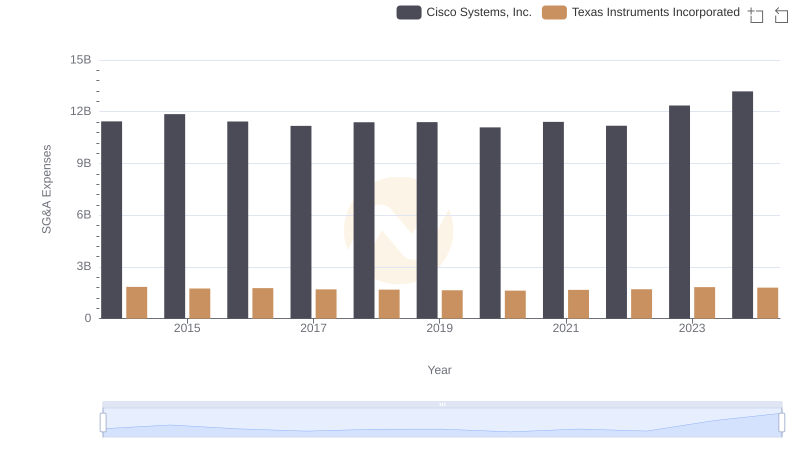
Cisco Systems, Inc. or Texas Instruments Incorporated: Who Manages SG&A Costs Better?
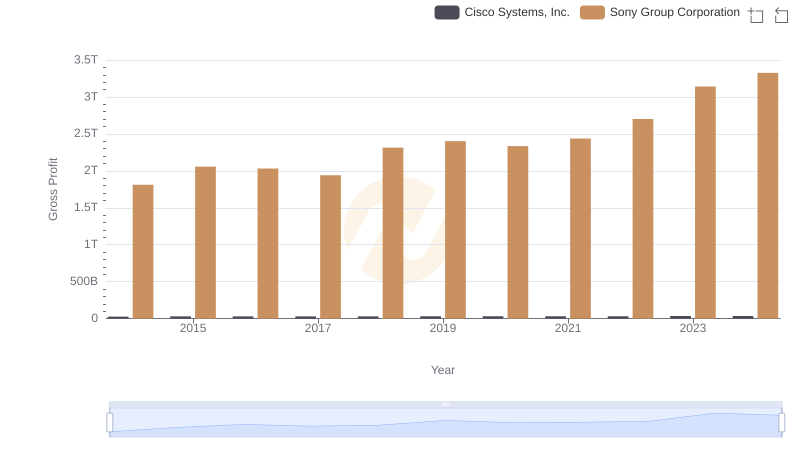
Who Generates Higher Gross Profit? Cisco Systems, Inc. or Sony Group Corporation
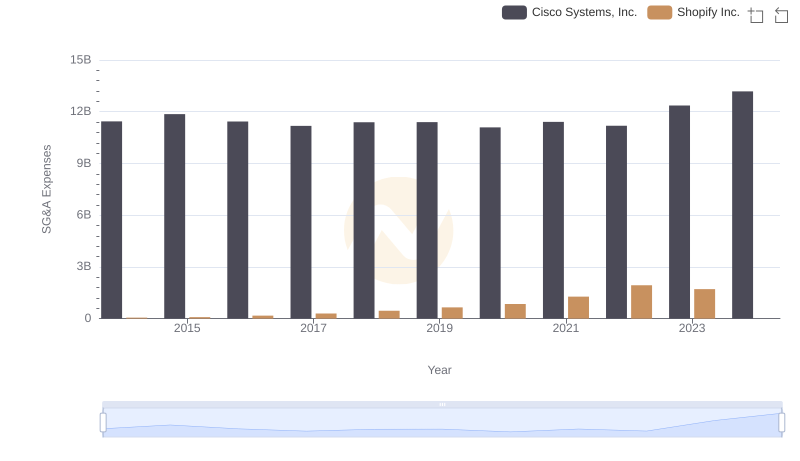
Cisco Systems, Inc. and Shopify Inc.: SG&A Spending Patterns Compared
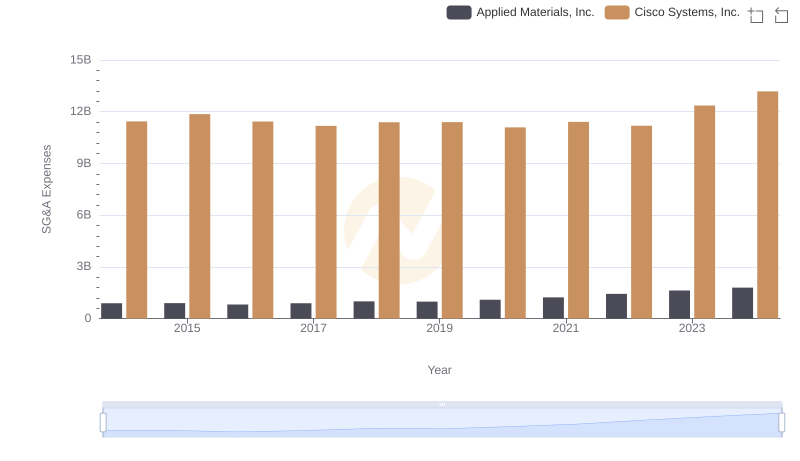
Operational Costs Compared: SG&A Analysis of Cisco Systems, Inc. and Applied Materials, Inc.
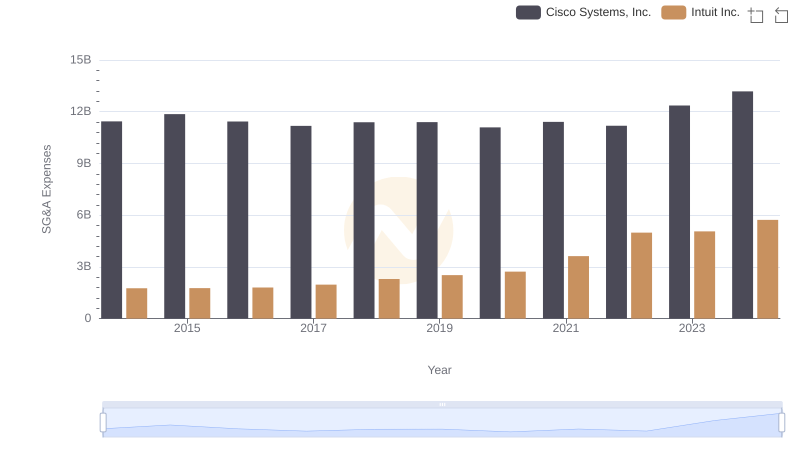
Cost Management Insights: SG&A Expenses for Cisco Systems, Inc. and Intuit Inc.
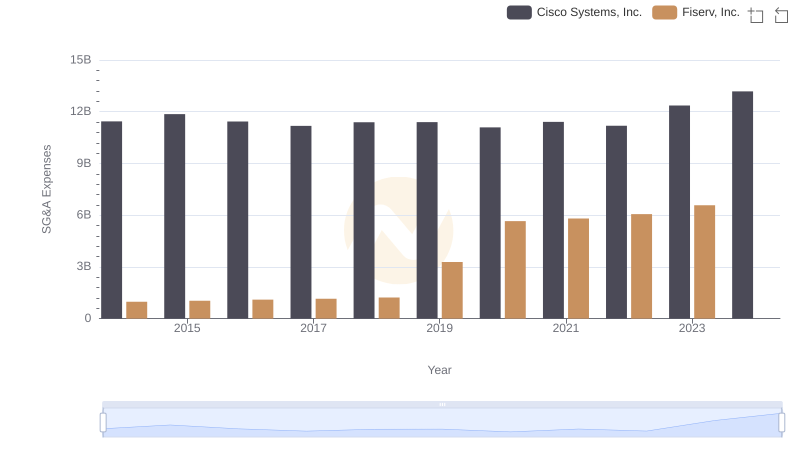
SG&A Efficiency Analysis: Comparing Cisco Systems, Inc. and Fiserv, Inc.

Comparing SG&A Expenses: Cisco Systems, Inc. vs Fiserv, Inc. Trends and Insights
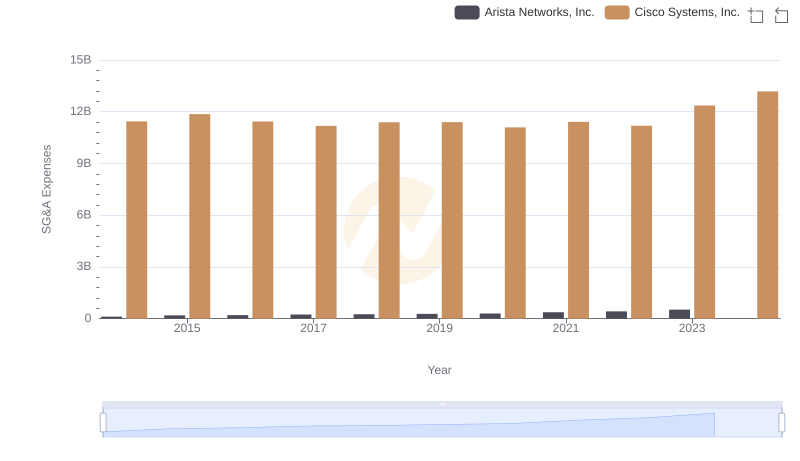
Operational Costs Compared: SG&A Analysis of Cisco Systems, Inc. and Arista Networks, Inc.
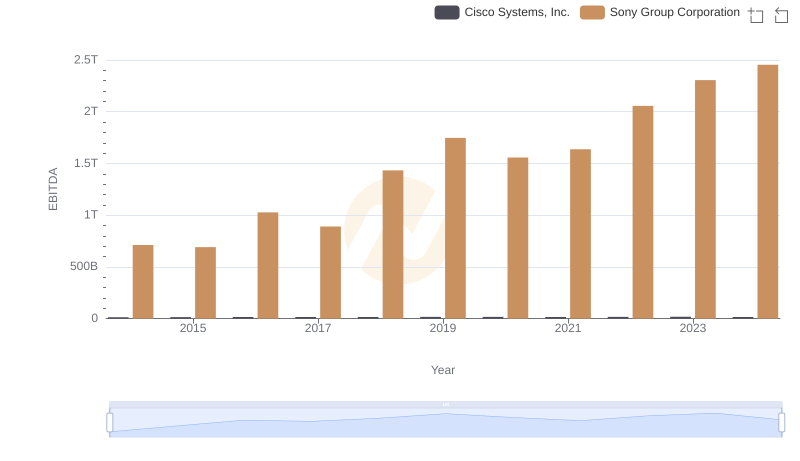
Comparative EBITDA Analysis: Cisco Systems, Inc. vs Sony Group Corporation
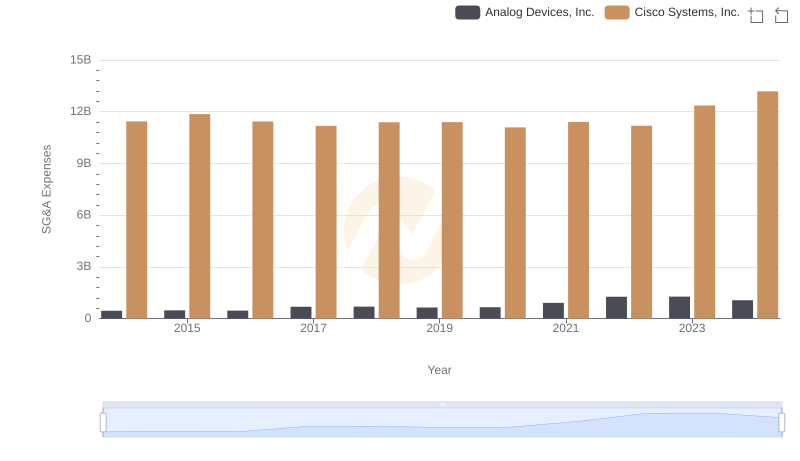
Cisco Systems, Inc. vs Analog Devices, Inc.: SG&A Expense Trends