| __timestamp | Cisco Systems, Inc. | CyberArk Software Ltd. |
|---|---|---|
| Wednesday, January 1, 2014 | 19373000000 | 14707000 |
| Thursday, January 1, 2015 | 19480000000 | 22660000 |
| Friday, January 1, 2016 | 18287000000 | 30151000 |
| Sunday, January 1, 2017 | 17781000000 | 41848000 |
| Monday, January 1, 2018 | 18724000000 | 48461000 |
| Tuesday, January 1, 2019 | 19238000000 | 62615000 |
| Wednesday, January 1, 2020 | 17618000000 | 82571000 |
| Friday, January 1, 2021 | 17924000000 | 93307000 |
| Saturday, January 1, 2022 | 19309000000 | 126046000 |
| Sunday, January 1, 2023 | 21245000000 | 156131000 |
| Monday, January 1, 2024 | 18975000000 | 215478000 |
Cracking the code
In the ever-evolving tech landscape, cost efficiency remains a pivotal factor for success. Cisco Systems, Inc. and CyberArk Software Ltd. offer a fascinating study in contrasts. Over the past decade, Cisco's cost of revenue has shown a steady trend, averaging around $18.9 billion annually. In contrast, CyberArk's cost of revenue, though significantly smaller, has grown from $14.7 million in 2014 to $156 million in 2023, marking a staggering increase of over 960%.
From 2014 to 2023, Cisco's cost of revenue fluctuated slightly, peaking in 2023. Meanwhile, CyberArk's costs surged, reflecting its rapid growth and expansion in the cybersecurity sector. Notably, 2024 data for CyberArk is missing, indicating potential reporting delays or strategic shifts.
This comparison highlights the diverse strategies of a tech giant and a cybersecurity specialist, offering insights into their operational efficiencies and market dynamics.
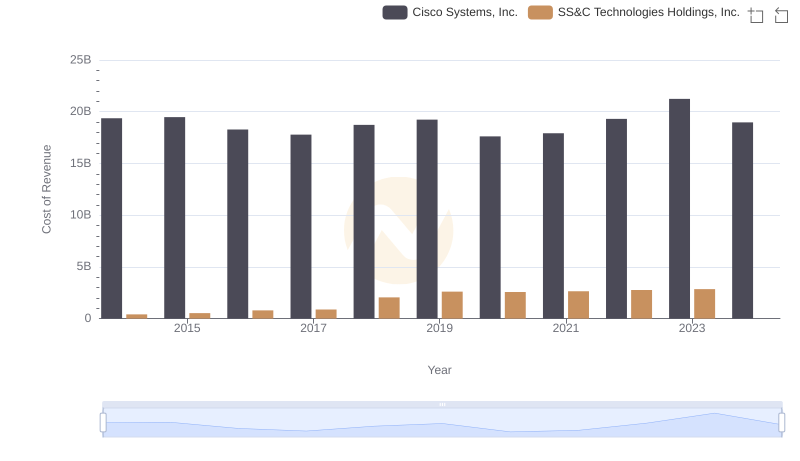
Cisco Systems, Inc. vs SS&C Technologies Holdings, Inc.: Efficiency in Cost of Revenue Explored
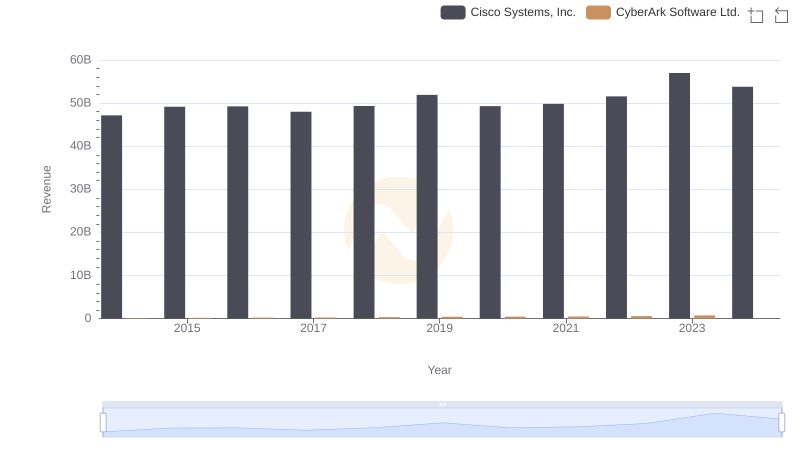
Cisco Systems, Inc. and CyberArk Software Ltd.: A Comprehensive Revenue Analysis
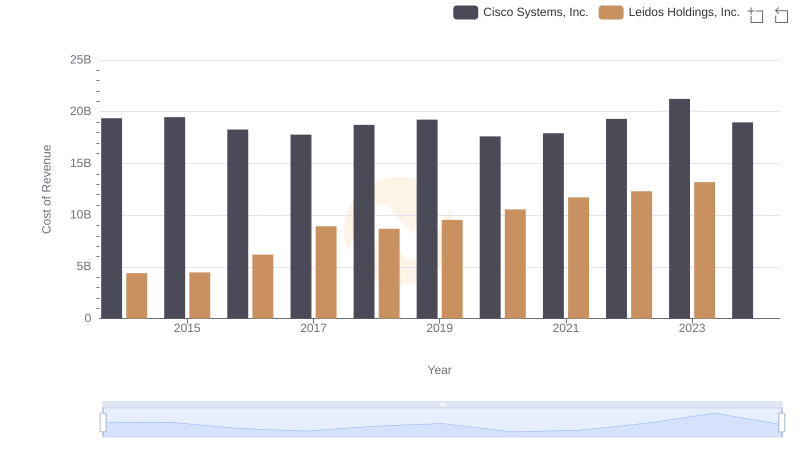
Analyzing Cost of Revenue: Cisco Systems, Inc. and Leidos Holdings, Inc.
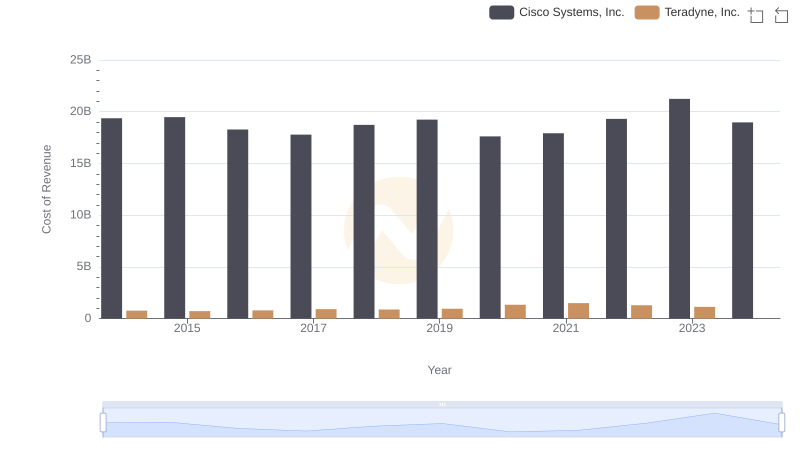
Cost of Revenue Comparison: Cisco Systems, Inc. vs Teradyne, Inc.
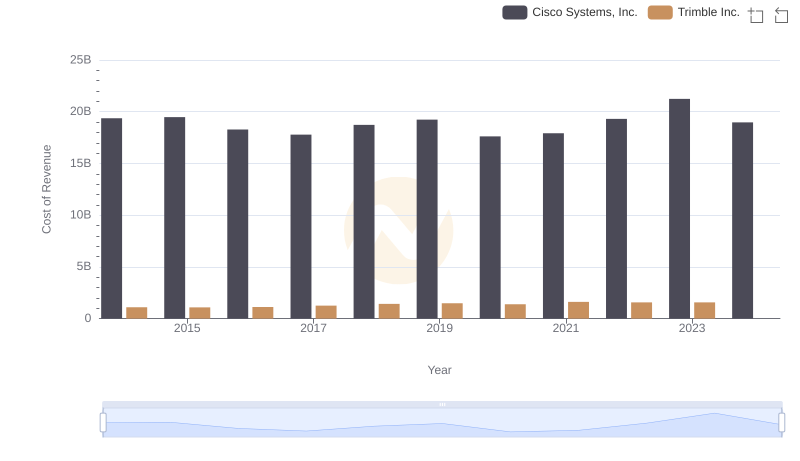
Cost Insights: Breaking Down Cisco Systems, Inc. and Trimble Inc.'s Expenses
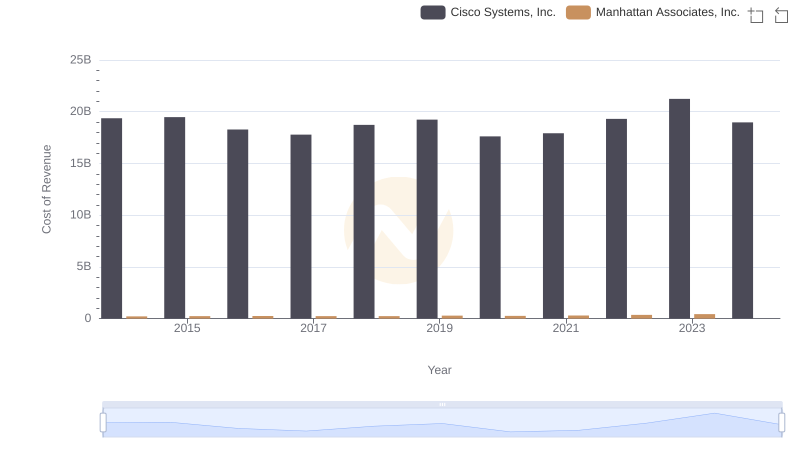
Cisco Systems, Inc. vs Manhattan Associates, Inc.: Efficiency in Cost of Revenue Explored
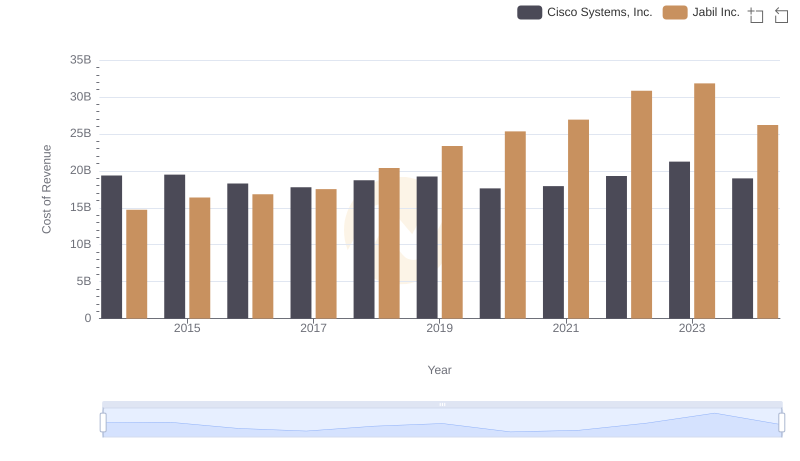
Analyzing Cost of Revenue: Cisco Systems, Inc. and Jabil Inc.
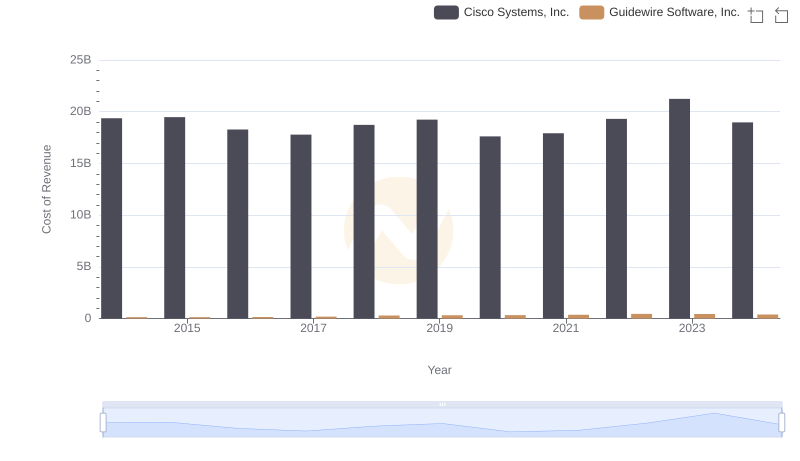
Cost of Revenue Trends: Cisco Systems, Inc. vs Guidewire Software, Inc.
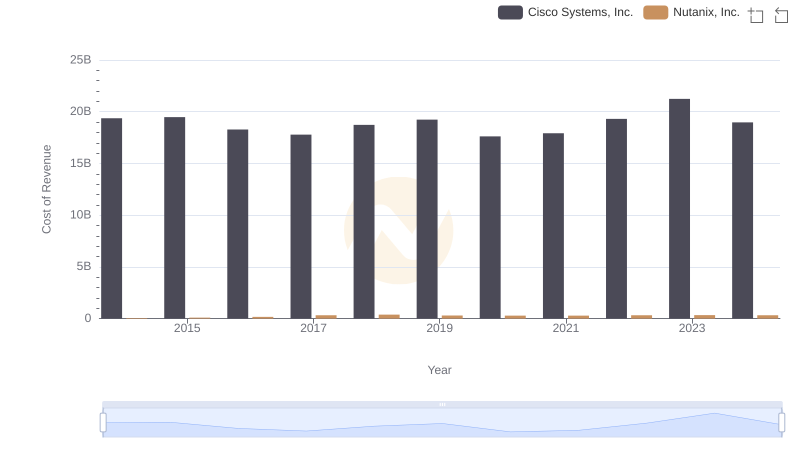
Cost Insights: Breaking Down Cisco Systems, Inc. and Nutanix, Inc.'s Expenses
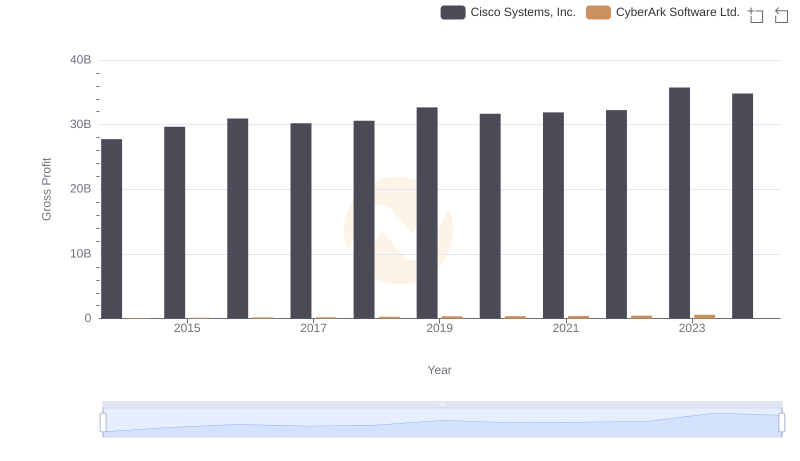
Gross Profit Analysis: Comparing Cisco Systems, Inc. and CyberArk Software Ltd.

Research and Development Expenses Breakdown: Cisco Systems, Inc. vs CyberArk Software Ltd.
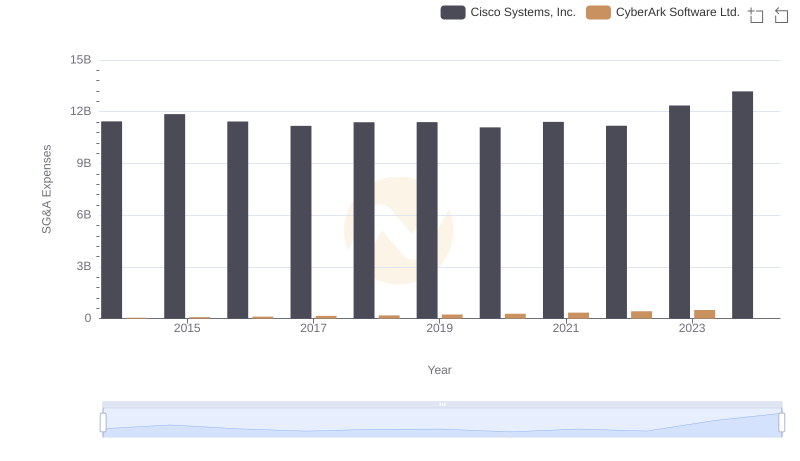
SG&A Efficiency Analysis: Comparing Cisco Systems, Inc. and CyberArk Software Ltd.