| __timestamp | Cisco Systems, Inc. | Manhattan Associates, Inc. |
|---|---|---|
| Wednesday, January 1, 2014 | 6294000000 | 48953000 |
| Thursday, January 1, 2015 | 6207000000 | 53859000 |
| Friday, January 1, 2016 | 6296000000 | 54736000 |
| Sunday, January 1, 2017 | 6059000000 | 57704000 |
| Monday, January 1, 2018 | 6332000000 | 71896000 |
| Tuesday, January 1, 2019 | 6577000000 | 87608000 |
| Wednesday, January 1, 2020 | 6347000000 | 84276000 |
| Friday, January 1, 2021 | 6549000000 | 97628000 |
| Saturday, January 1, 2022 | 6774000000 | 111877000 |
| Sunday, January 1, 2023 | 7551000000 | 126814000 |
| Monday, January 1, 2024 | 7983000000 | 137689000 |
Igniting the spark of knowledge
In the ever-evolving tech landscape, innovation is the lifeblood of success. Cisco Systems, Inc. and Manhattan Associates, Inc. exemplify this through their research and development (R&D) investments over the past decade. From 2014 to 2024, Cisco's R&D expenses surged by approximately 27%, reflecting its commitment to maintaining a competitive edge in networking and cybersecurity. Meanwhile, Manhattan Associates, a leader in supply chain solutions, increased its R&D spending by nearly 181%, showcasing its dedication to innovation in logistics and software.
Cisco's R&D spending consistently hovered around 6.3 billion USD in the early years, peaking at nearly 8 billion USD by 2024. In contrast, Manhattan Associates started with a modest 49 million USD, reaching approximately 138 million USD in 2024. This stark contrast highlights the diverse strategies and scales of innovation between these two industry giants.
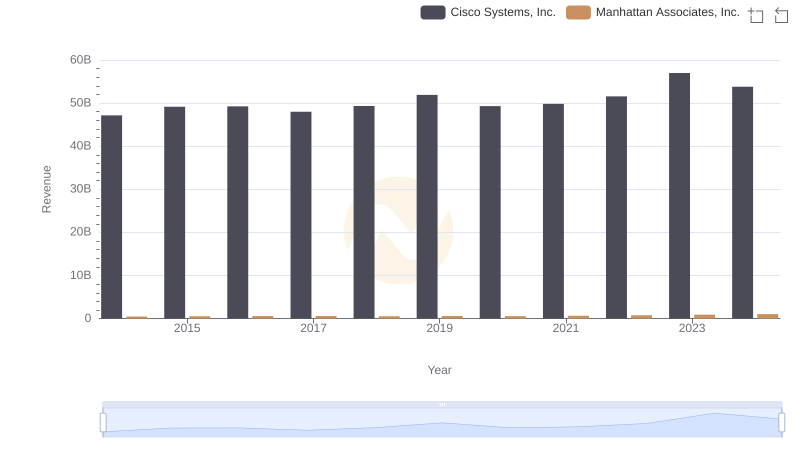
Cisco Systems, Inc. and Manhattan Associates, Inc.: A Comprehensive Revenue Analysis
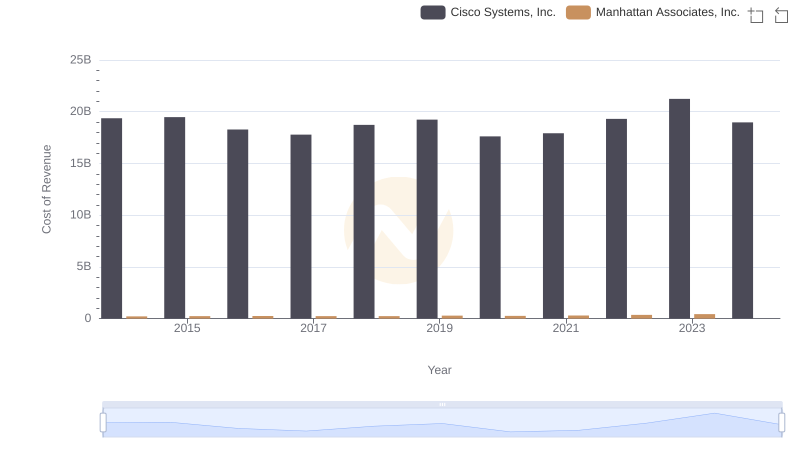
Cisco Systems, Inc. vs Manhattan Associates, Inc.: Efficiency in Cost of Revenue Explored
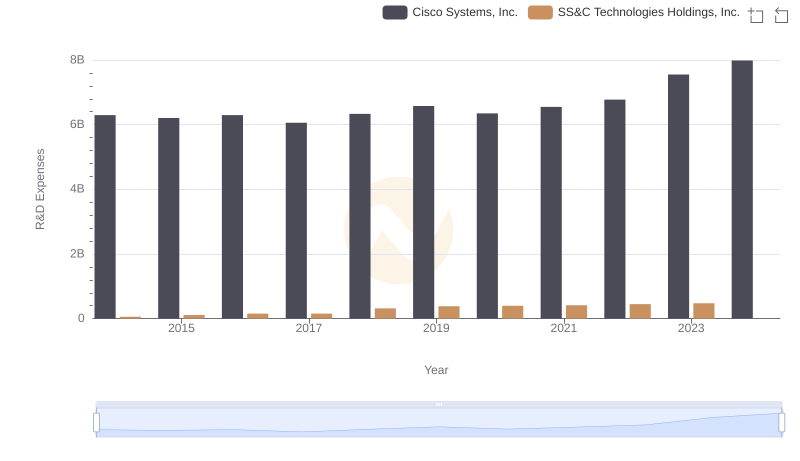
R&D Insights: How Cisco Systems, Inc. and SS&C Technologies Holdings, Inc. Allocate Funds

Cisco Systems, Inc. and Manhattan Associates, Inc.: A Detailed Gross Profit Analysis
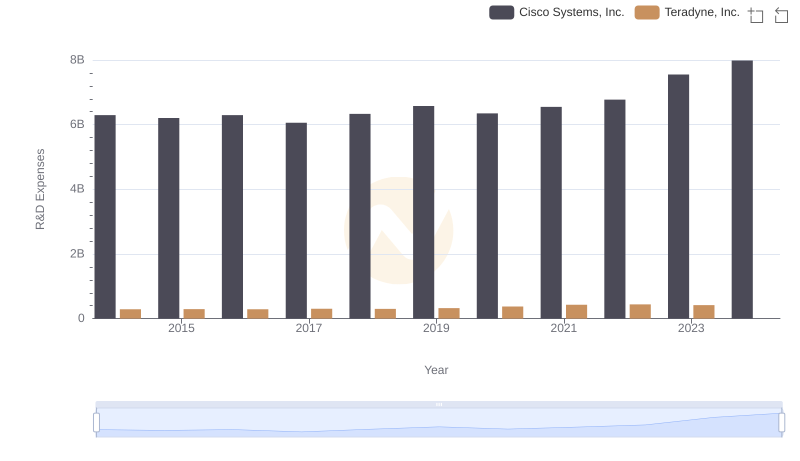
Research and Development Expenses Breakdown: Cisco Systems, Inc. vs Teradyne, Inc.

Who Prioritizes Innovation? R&D Spending Compared for Cisco Systems, Inc. and Trimble Inc.

Research and Development Expenses Breakdown: Cisco Systems, Inc. vs CyberArk Software Ltd.
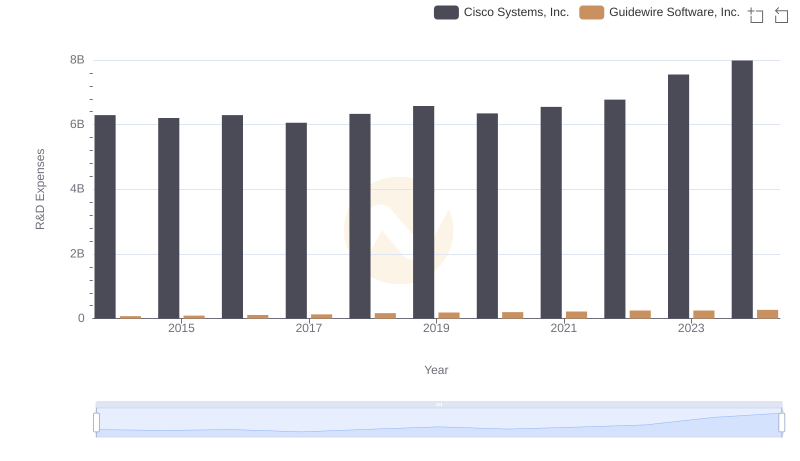
Who Prioritizes Innovation? R&D Spending Compared for Cisco Systems, Inc. and Guidewire Software, Inc.
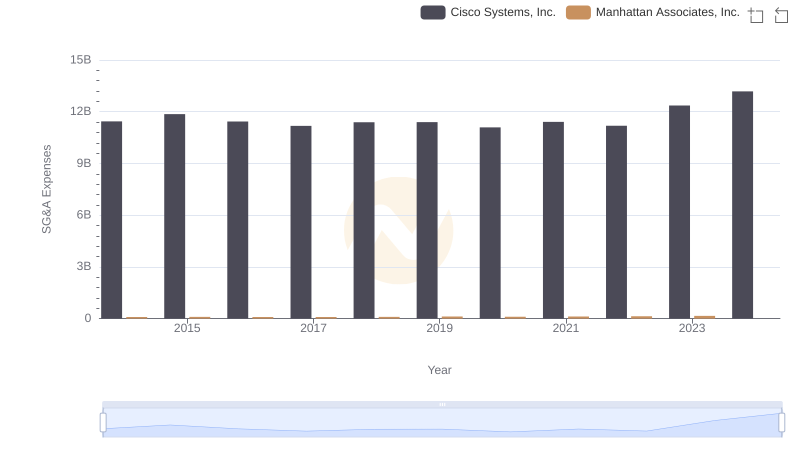
Who Optimizes SG&A Costs Better? Cisco Systems, Inc. or Manhattan Associates, Inc.
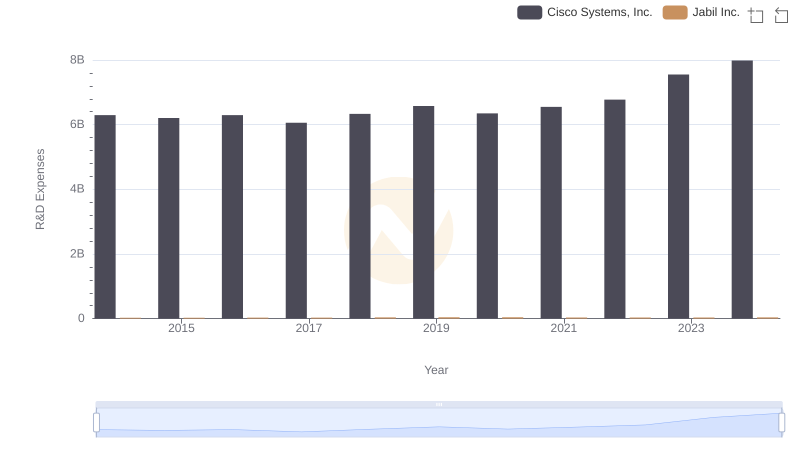
R&D Insights: How Cisco Systems, Inc. and Jabil Inc. Allocate Funds
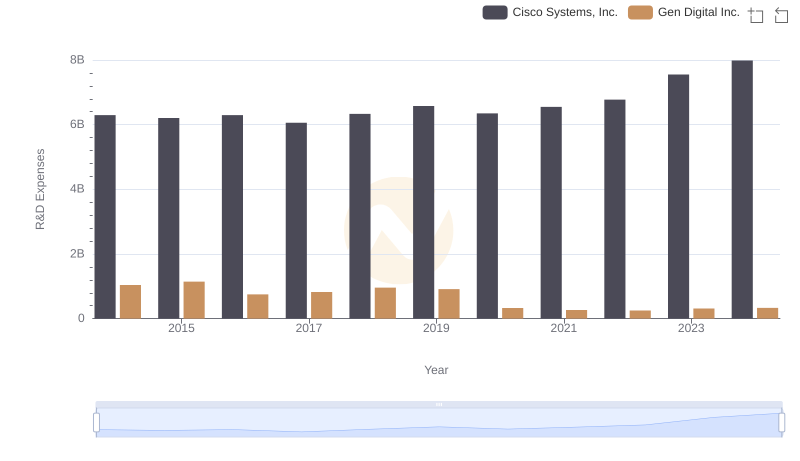
R&D Spending Showdown: Cisco Systems, Inc. vs Gen Digital Inc.
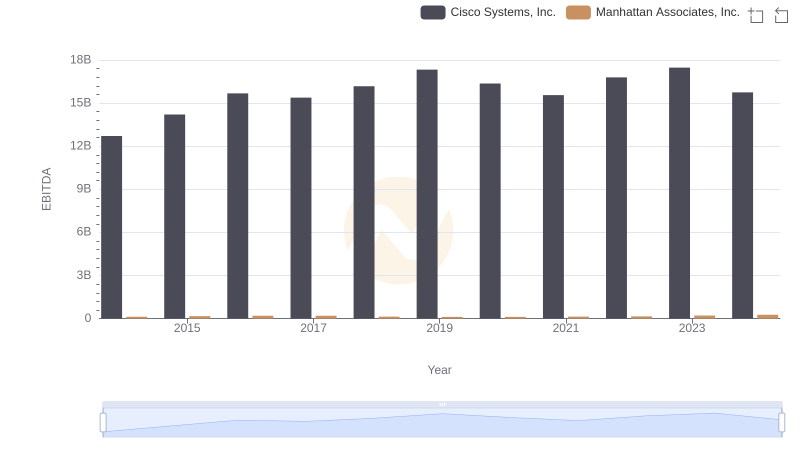
Cisco Systems, Inc. vs Manhattan Associates, Inc.: In-Depth EBITDA Performance Comparison