| __timestamp | Cisco Systems, Inc. | Manhattan Associates, Inc. |
|---|---|---|
| Wednesday, January 1, 2014 | 12709000000 | 133501000 |
| Thursday, January 1, 2015 | 14209000000 | 169210000 |
| Friday, January 1, 2016 | 15678000000 | 203397000 |
| Sunday, January 1, 2017 | 15383000000 | 197626000 |
| Monday, January 1, 2018 | 16172000000 | 142500000 |
| Tuesday, January 1, 2019 | 17334000000 | 123911000 |
| Wednesday, January 1, 2020 | 16363000000 | 123007000 |
| Friday, January 1, 2021 | 15558000000 | 142247000 |
| Saturday, January 1, 2022 | 16794000000 | 159363000 |
| Sunday, January 1, 2023 | 17471000000 | 215633000 |
| Monday, January 1, 2024 | 15747000000 | 267897000 |
Cracking the code
In the ever-evolving tech landscape, Cisco Systems, Inc. and Manhattan Associates, Inc. have showcased distinct EBITDA trajectories from 2014 to 2024. Cisco, a stalwart in networking, consistently outperformed with an average EBITDA of approximately $15.8 billion, peaking in 2023 with a 37% increase from 2014. Meanwhile, Manhattan Associates, a leader in supply chain solutions, demonstrated a steady growth, culminating in a 105% rise over the same period, reaching its zenith in 2024. This comparison highlights Cisco's robust financial stability and Manhattan's impressive growth trajectory. As the tech industry continues to innovate, these trends underscore the diverse strategies and market positions of these two giants. Investors and analysts should note the resilience and adaptability of both companies as they navigate the challenges and opportunities of the digital age.
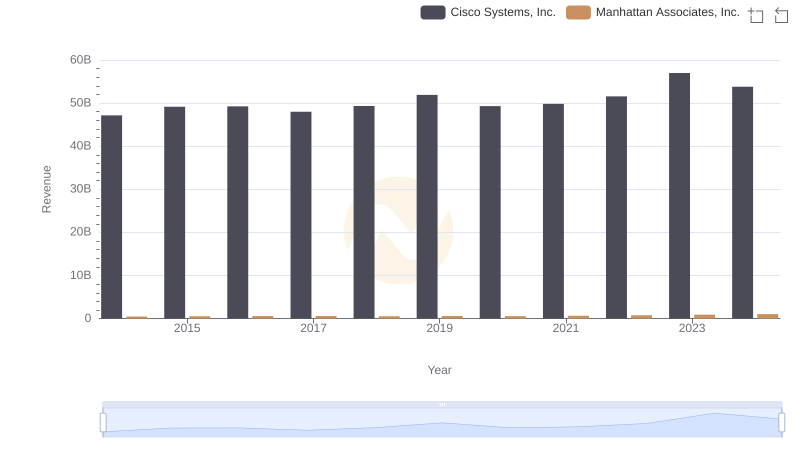
Cisco Systems, Inc. and Manhattan Associates, Inc.: A Comprehensive Revenue Analysis
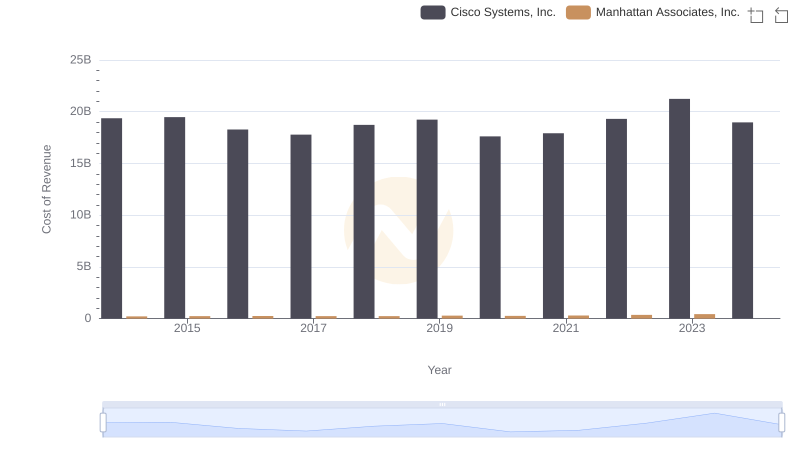
Cisco Systems, Inc. vs Manhattan Associates, Inc.: Efficiency in Cost of Revenue Explored

Cisco Systems, Inc. and Manhattan Associates, Inc.: A Detailed Gross Profit Analysis
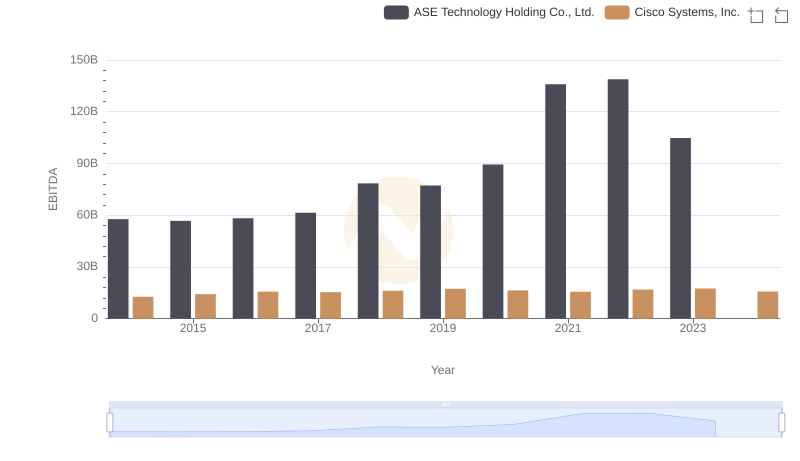
EBITDA Analysis: Evaluating Cisco Systems, Inc. Against ASE Technology Holding Co., Ltd.
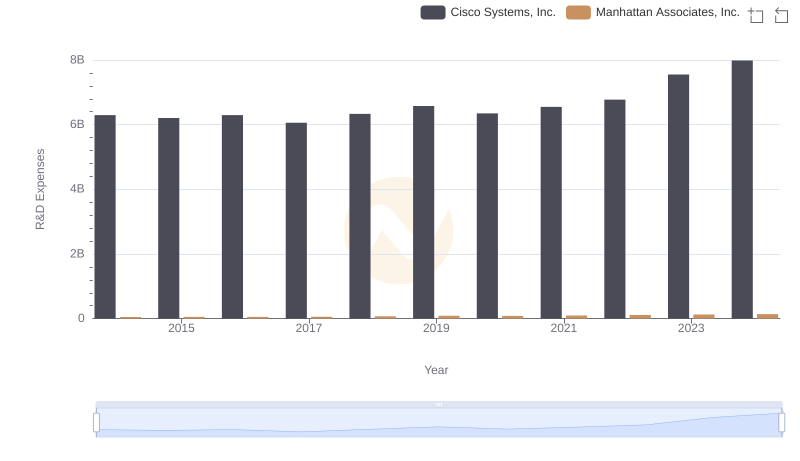
Comparing Innovation Spending: Cisco Systems, Inc. and Manhattan Associates, Inc.
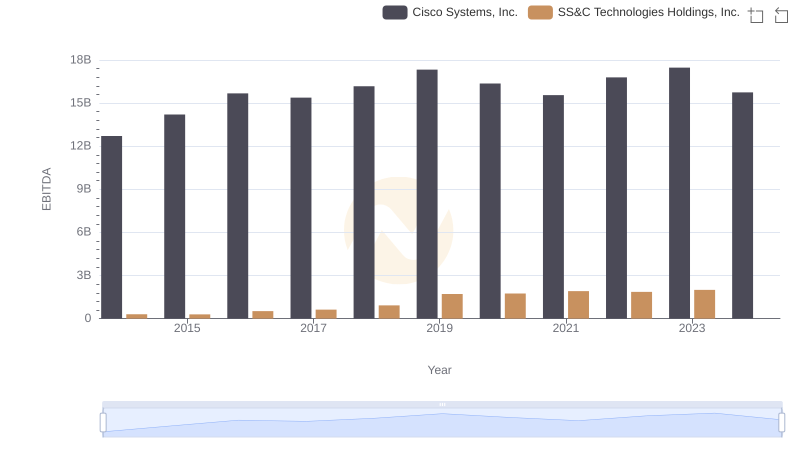
Cisco Systems, Inc. vs SS&C Technologies Holdings, Inc.: In-Depth EBITDA Performance Comparison
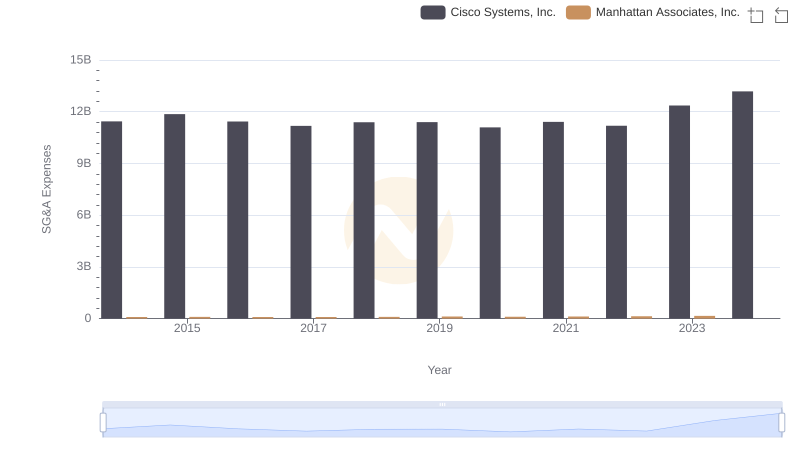
Who Optimizes SG&A Costs Better? Cisco Systems, Inc. or Manhattan Associates, Inc.
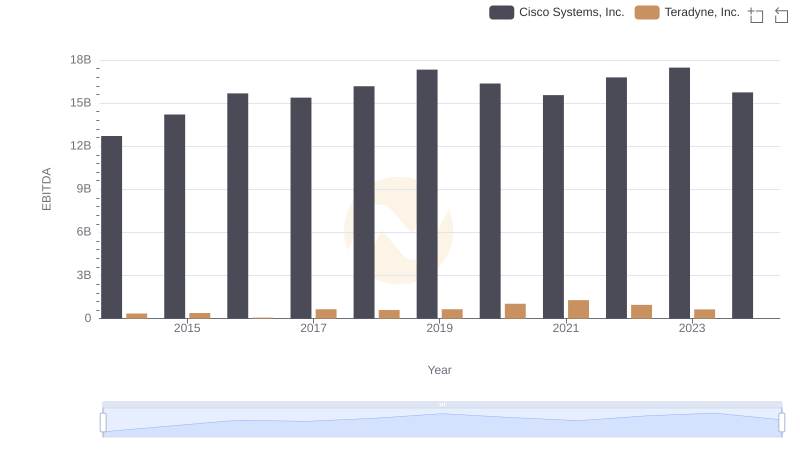
A Side-by-Side Analysis of EBITDA: Cisco Systems, Inc. and Teradyne, Inc.
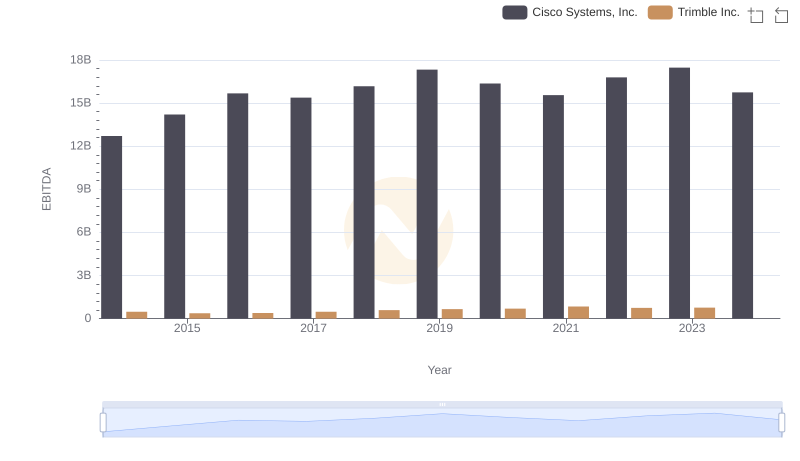
Comparative EBITDA Analysis: Cisco Systems, Inc. vs Trimble Inc.

Professional EBITDA Benchmarking: Cisco Systems, Inc. vs Gen Digital Inc.
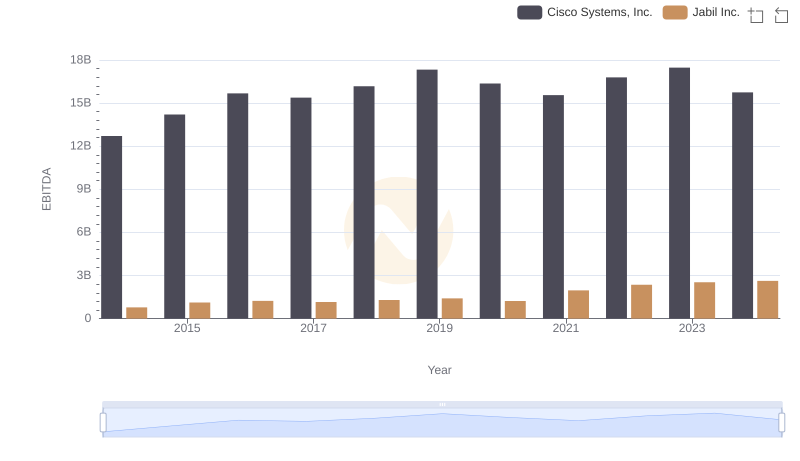
Professional EBITDA Benchmarking: Cisco Systems, Inc. vs Jabil Inc.
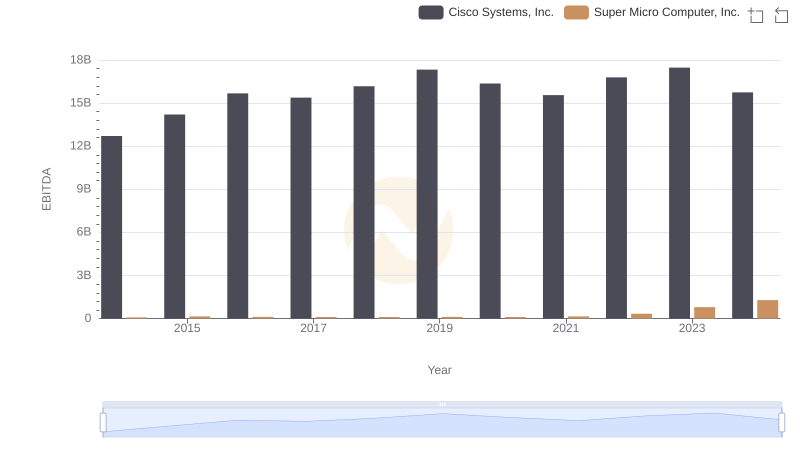
EBITDA Performance Review: Cisco Systems, Inc. vs Super Micro Computer, Inc.