| __timestamp | Cisco Systems, Inc. | Manhattan Associates, Inc. |
|---|---|---|
| Wednesday, January 1, 2014 | 47142000000 | 492104000 |
| Thursday, January 1, 2015 | 49161000000 | 556371000 |
| Friday, January 1, 2016 | 49247000000 | 604557000 |
| Sunday, January 1, 2017 | 48005000000 | 594599000 |
| Monday, January 1, 2018 | 49330000000 | 559157000 |
| Tuesday, January 1, 2019 | 51904000000 | 617949000 |
| Wednesday, January 1, 2020 | 49301000000 | 586372000 |
| Friday, January 1, 2021 | 49818000000 | 663643000 |
| Saturday, January 1, 2022 | 51557000000 | 767084000 |
| Sunday, January 1, 2023 | 56998000000 | 928725000 |
| Monday, January 1, 2024 | 53803000000 | 1042352000 |
Data in motion
In the ever-evolving tech landscape, Cisco Systems, Inc. and Manhattan Associates, Inc. have demonstrated remarkable revenue trajectories over the past decade. From 2014 to 2024, Cisco's revenue surged by approximately 14%, peaking in 2023 with a 21% increase from its 2014 figures. Meanwhile, Manhattan Associates showcased an impressive growth of over 112%, reflecting its dynamic adaptation to market demands.
Cisco's revenue journey highlights its resilience and strategic market positioning. Despite fluctuations, the company maintained a steady growth rate, with a notable spike in 2023, reaching its highest revenue point.
Manhattan Associates, though smaller in scale, has consistently outpaced its own past performance, doubling its revenue since 2014. This growth underscores its innovative approach in supply chain solutions.
Both companies exemplify the diverse strategies within the tech industry, each carving its path to success.

Revenue Insights: Cisco Systems, Inc. and Trimble Inc. Performance Compared
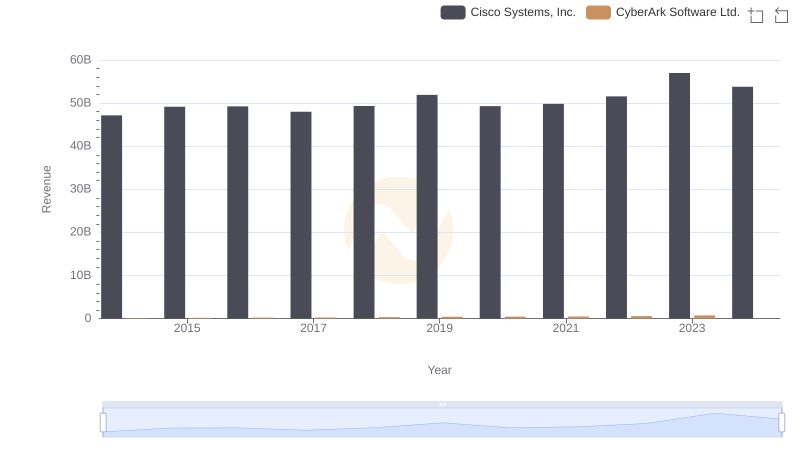
Cisco Systems, Inc. and CyberArk Software Ltd.: A Comprehensive Revenue Analysis
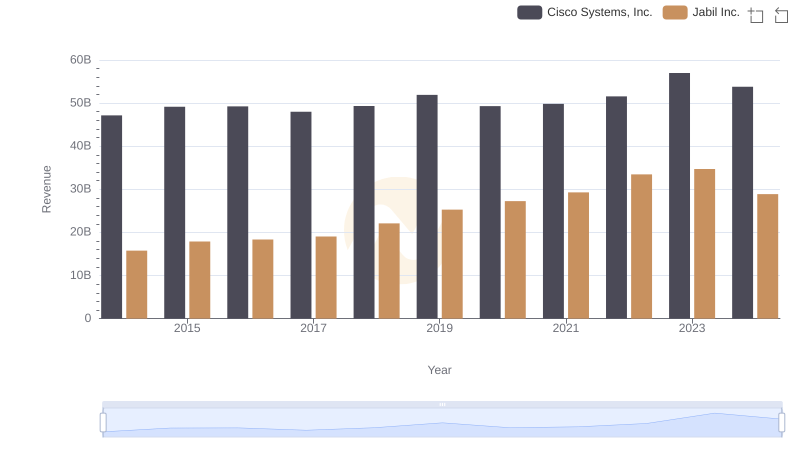
Revenue Insights: Cisco Systems, Inc. and Jabil Inc. Performance Compared
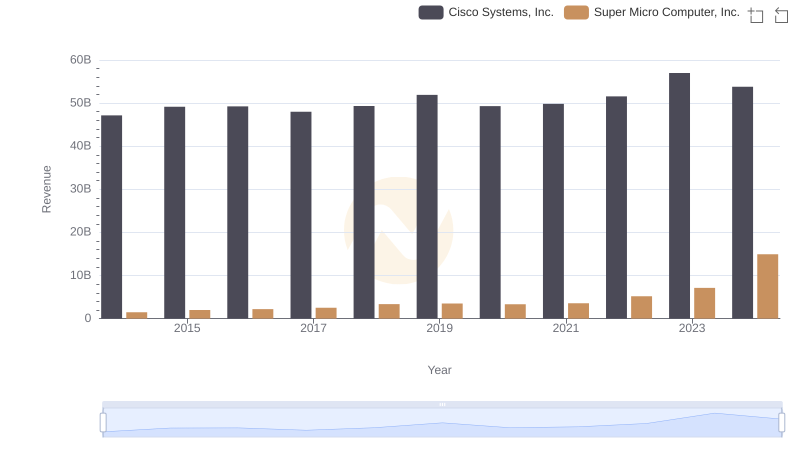
Cisco Systems, Inc. vs Super Micro Computer, Inc.: Examining Key Revenue Metrics
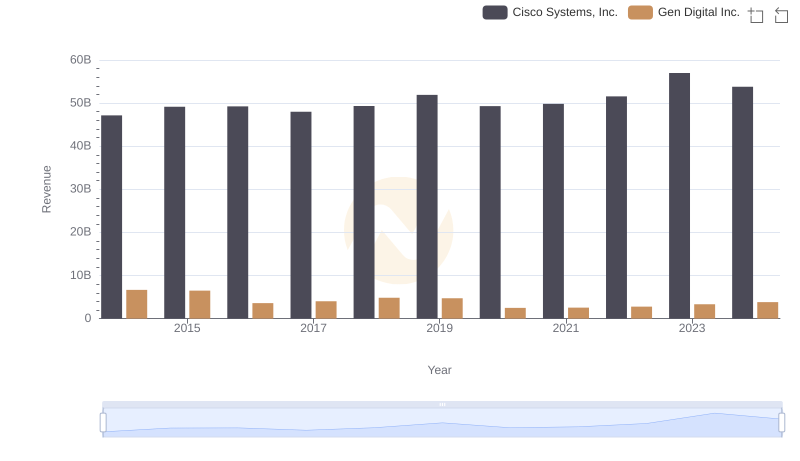
Breaking Down Revenue Trends: Cisco Systems, Inc. vs Gen Digital Inc.
Breaking Down Revenue Trends: Cisco Systems, Inc. vs Guidewire Software, Inc.
Cisco Systems, Inc. vs Manhattan Associates, Inc.: Efficiency in Cost of Revenue Explored
Comparing Revenue Performance: Cisco Systems, Inc. or Nutanix, Inc.?

Cisco Systems, Inc. and Manhattan Associates, Inc.: A Detailed Gross Profit Analysis
Comparing Innovation Spending: Cisco Systems, Inc. and Manhattan Associates, Inc.
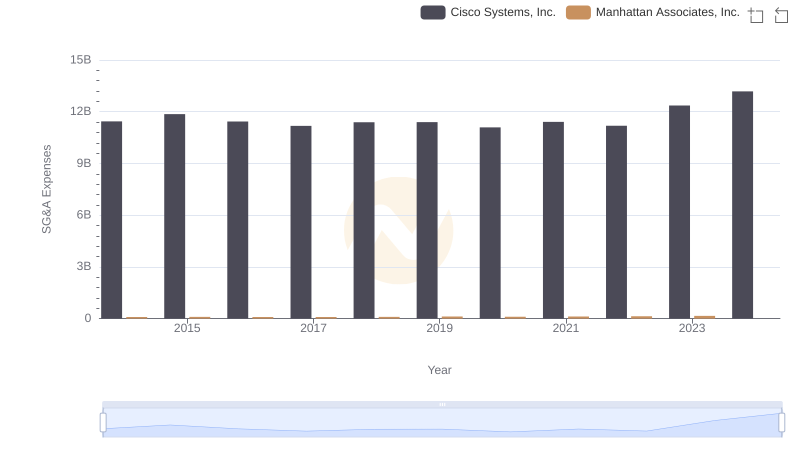
Who Optimizes SG&A Costs Better? Cisco Systems, Inc. or Manhattan Associates, Inc.
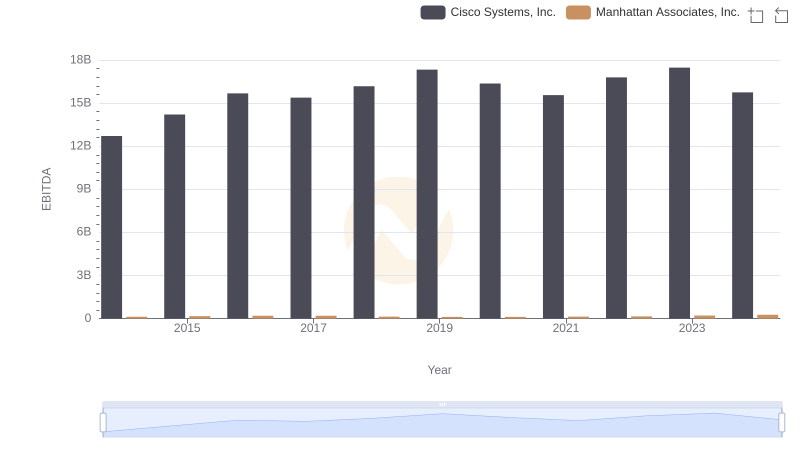
Cisco Systems, Inc. vs Manhattan Associates, Inc.: In-Depth EBITDA Performance Comparison