| __timestamp | Check Point Software Technologies Ltd. | Cisco Systems, Inc. |
|---|---|---|
| Wednesday, January 1, 2014 | 812338000 | 12709000000 |
| Thursday, January 1, 2015 | 853687000 | 14209000000 |
| Friday, January 1, 2016 | 867006000 | 15678000000 |
| Sunday, January 1, 2017 | 940553000 | 15383000000 |
| Monday, January 1, 2018 | 934562000 | 16172000000 |
| Tuesday, January 1, 2019 | 905800000 | 17334000000 |
| Wednesday, January 1, 2020 | 931300000 | 16363000000 |
| Friday, January 1, 2021 | 938200000 | 15558000000 |
| Saturday, January 1, 2022 | 920500000 | 16794000000 |
| Sunday, January 1, 2023 | 1023000000 | 17471000000 |
| Monday, January 1, 2024 | 15747000000 |
Cracking the code
In the ever-evolving tech landscape, Cisco Systems, Inc. and Check Point Software Technologies Ltd. have been pivotal players. Over the past decade, Cisco has consistently outperformed Check Point in terms of EBITDA, showcasing its robust financial health. From 2014 to 2023, Cisco's EBITDA grew by approximately 37%, peaking in 2023. In contrast, Check Point's EBITDA saw a modest increase of around 26% over the same period, with its highest value recorded in 2023. This comparison highlights Cisco's strategic prowess in maintaining a competitive edge. However, it's noteworthy that data for 2024 is incomplete, with Check Point's figures missing. This analysis underscores the importance of strategic financial management in sustaining growth in the tech industry. As we look to the future, these insights provide a valuable benchmark for investors and industry analysts alike.
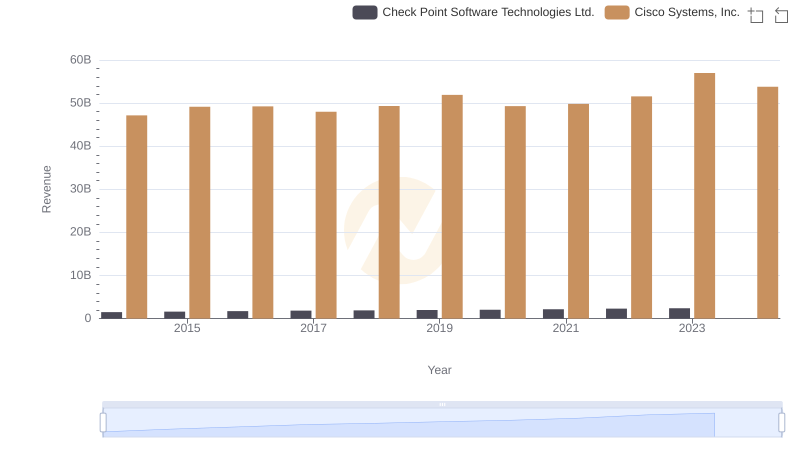
Annual Revenue Comparison: Cisco Systems, Inc. vs Check Point Software Technologies Ltd.
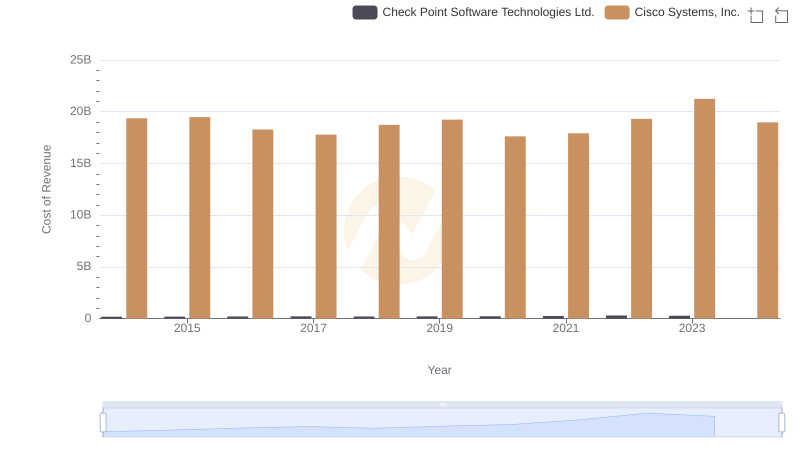
Cisco Systems, Inc. vs Check Point Software Technologies Ltd.: Efficiency in Cost of Revenue Explored
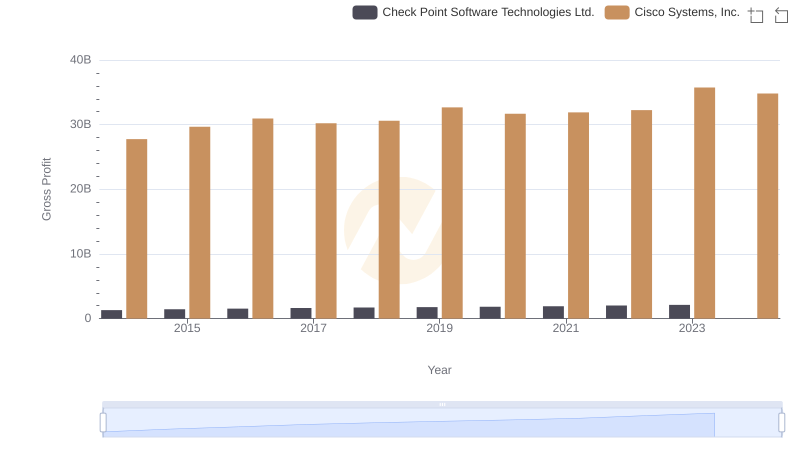
Key Insights on Gross Profit: Cisco Systems, Inc. vs Check Point Software Technologies Ltd.
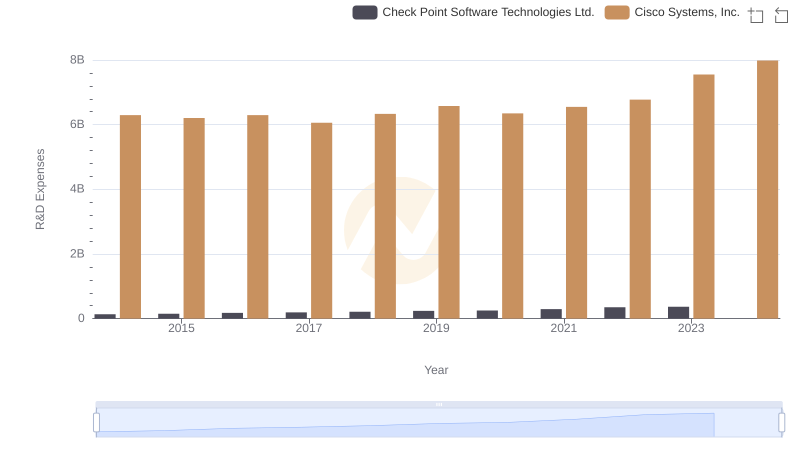
Cisco Systems, Inc. vs Check Point Software Technologies Ltd.: Strategic Focus on R&D Spending
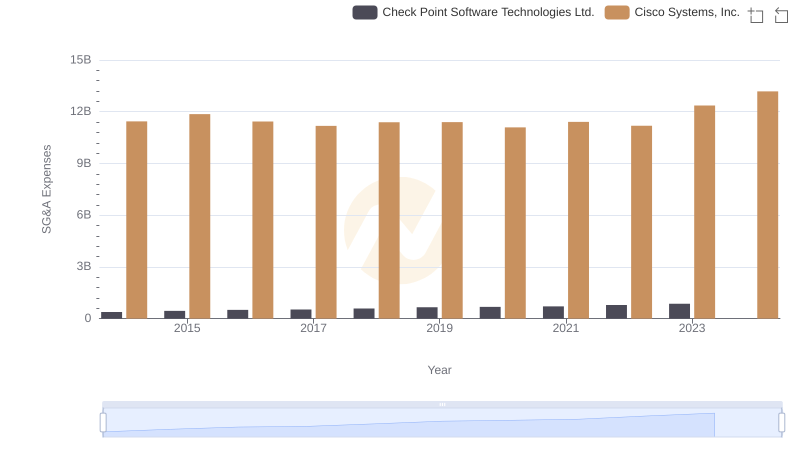
Cisco Systems, Inc. vs Check Point Software Technologies Ltd.: SG&A Expense Trends

Professional EBITDA Benchmarking: Cisco Systems, Inc. vs ON Semiconductor Corporation
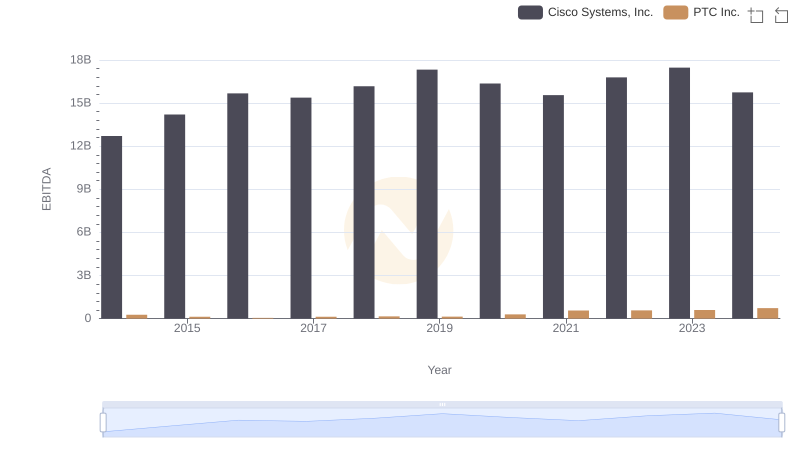
A Professional Review of EBITDA: Cisco Systems, Inc. Compared to PTC Inc.
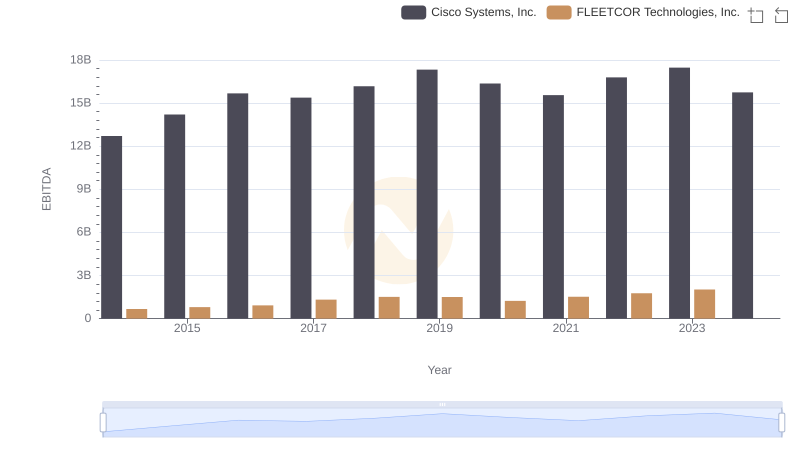
EBITDA Metrics Evaluated: Cisco Systems, Inc. vs FLEETCOR Technologies, Inc.
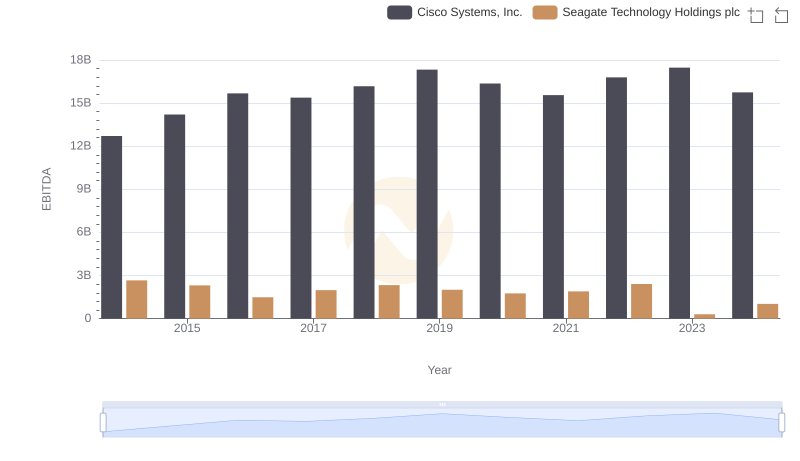
Cisco Systems, Inc. and Seagate Technology Holdings plc: A Detailed Examination of EBITDA Performance
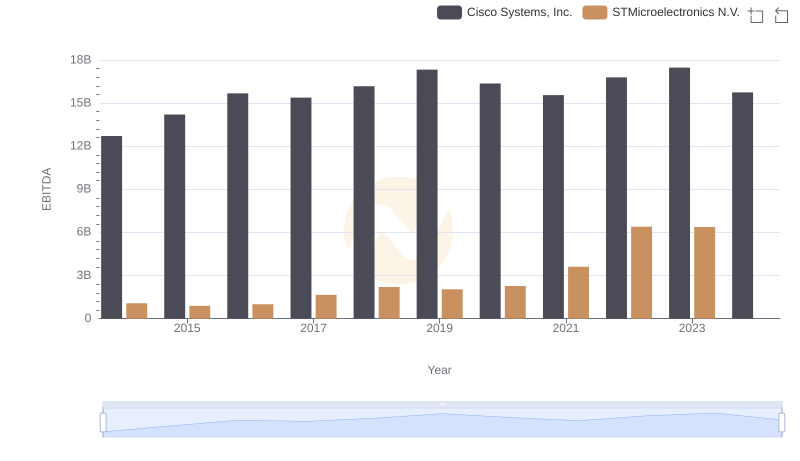
EBITDA Analysis: Evaluating Cisco Systems, Inc. Against STMicroelectronics N.V.
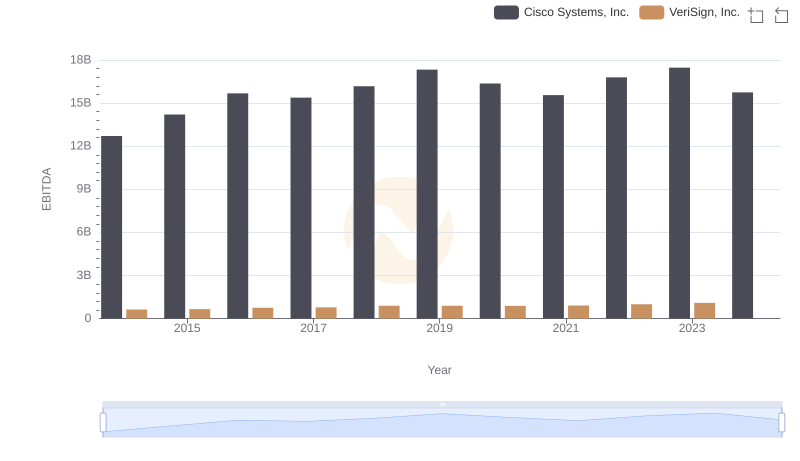
EBITDA Metrics Evaluated: Cisco Systems, Inc. vs VeriSign, Inc.
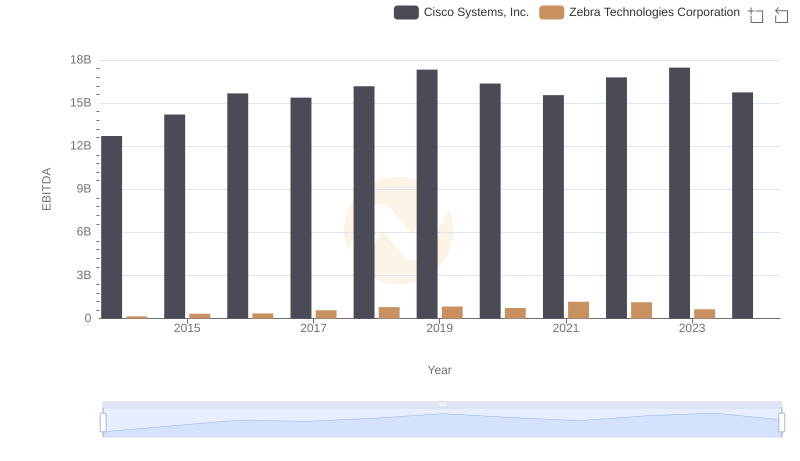
EBITDA Performance Review: Cisco Systems, Inc. vs Zebra Technologies Corporation