| __timestamp | Cisco Systems, Inc. | FLEETCOR Technologies, Inc. |
|---|---|---|
| Wednesday, January 1, 2014 | 11437000000 | 377744000 |
| Thursday, January 1, 2015 | 11861000000 | 515047000 |
| Friday, January 1, 2016 | 11433000000 | 519413000 |
| Sunday, January 1, 2017 | 11177000000 | 671544000 |
| Monday, January 1, 2018 | 11386000000 | 571765000 |
| Tuesday, January 1, 2019 | 11398000000 | 612016000 |
| Wednesday, January 1, 2020 | 11094000000 | 567410000 |
| Friday, January 1, 2021 | 11411000000 | 747948000 |
| Saturday, January 1, 2022 | 11186000000 | 893217000 |
| Sunday, January 1, 2023 | 12358000000 | 1034248000 |
| Monday, January 1, 2024 | 13177000000 | 997780000 |
Igniting the spark of knowledge
In the ever-evolving landscape of corporate finance, understanding the trends in Selling, General, and Administrative (SG&A) expenses is crucial for investors and analysts alike. Over the past decade, Cisco Systems, Inc. has consistently outpaced FLEETCOR Technologies, Inc. in SG&A expenditures. From 2014 to 2023, Cisco's SG&A expenses have shown a steady increase, peaking at approximately $13.2 billion in 2024, marking a 15% rise from 2014. In contrast, FLEETCOR's expenses have grown more modestly, reaching around $1 billion in 2023, a significant increase from $378 million in 2014. This disparity highlights Cisco's expansive operational scale and strategic investments in administrative functions. However, the data for 2024 is incomplete for FLEETCOR, indicating potential shifts in their financial strategy. As businesses navigate the complexities of the modern economy, these trends offer valuable insights into their operational priorities and financial health.
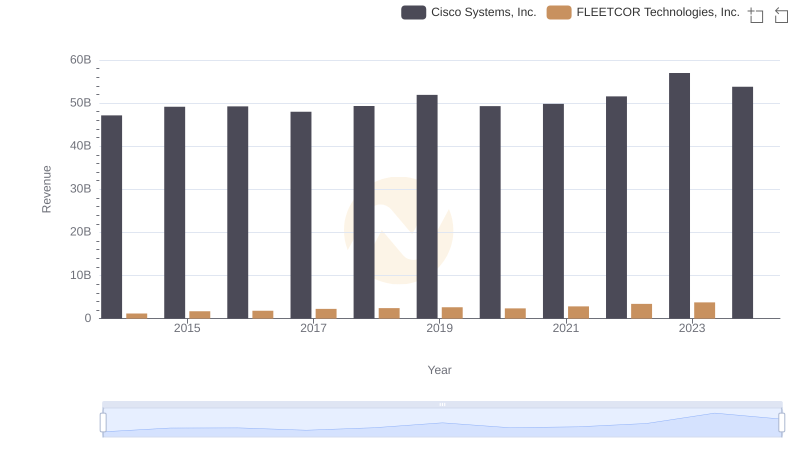
Revenue Insights: Cisco Systems, Inc. and FLEETCOR Technologies, Inc. Performance Compared
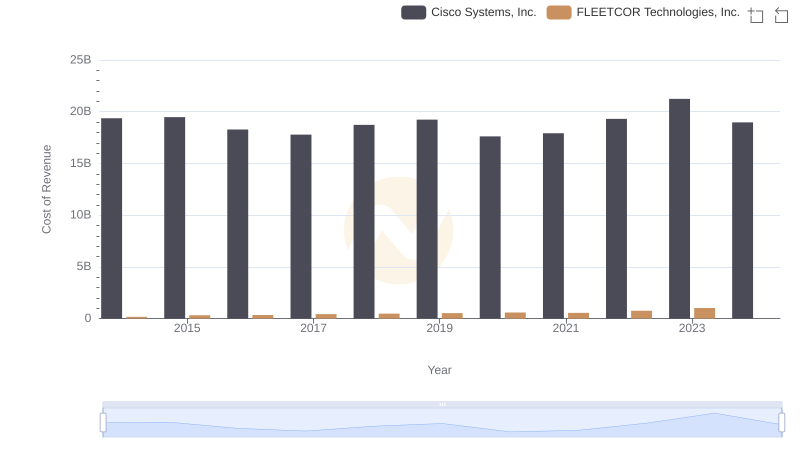
Cost Insights: Breaking Down Cisco Systems, Inc. and FLEETCOR Technologies, Inc.'s Expenses
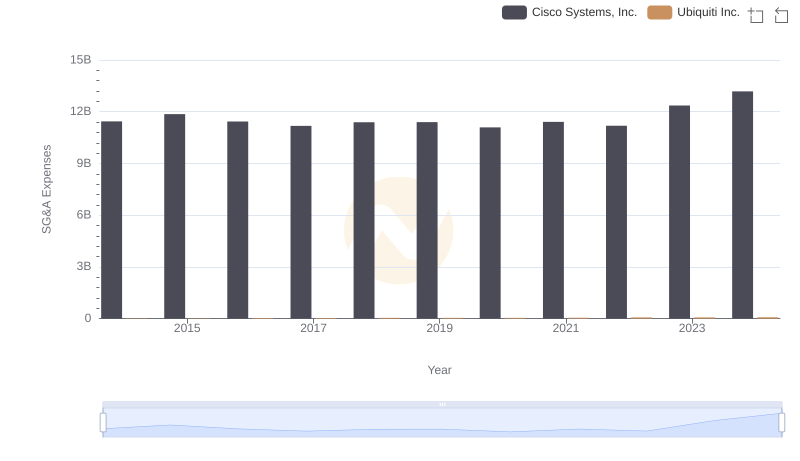
Cisco Systems, Inc. vs Ubiquiti Inc.: SG&A Expense Trends
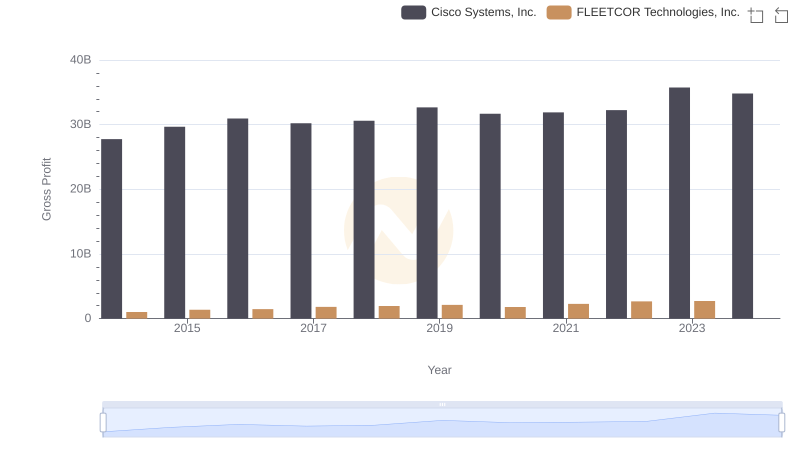
Gross Profit Analysis: Comparing Cisco Systems, Inc. and FLEETCOR Technologies, Inc.
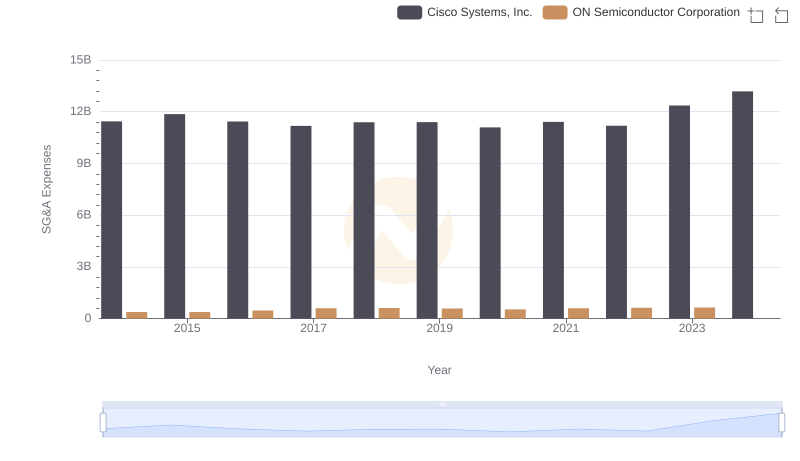
Selling, General, and Administrative Costs: Cisco Systems, Inc. vs ON Semiconductor Corporation
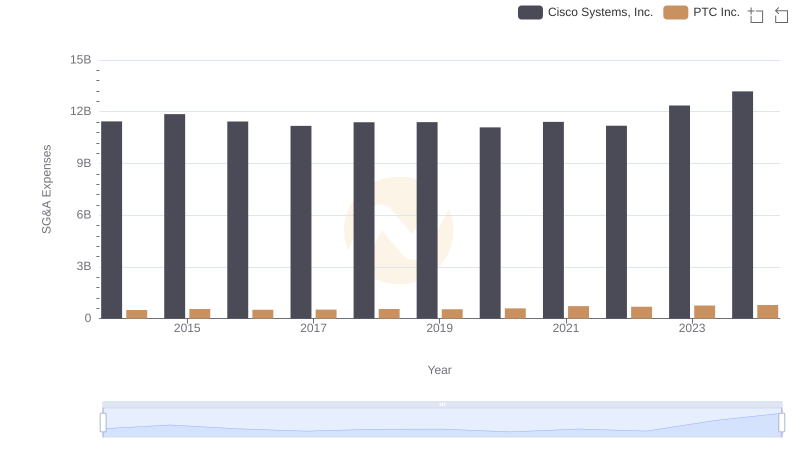
Cisco Systems, Inc. vs PTC Inc.: SG&A Expense Trends
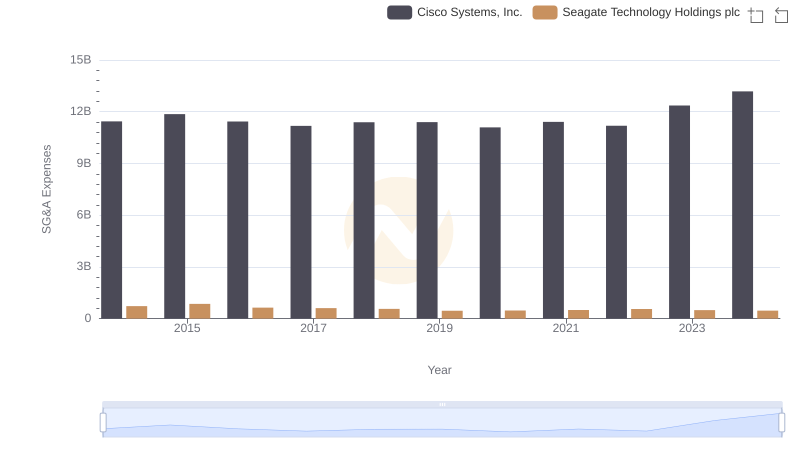
SG&A Efficiency Analysis: Comparing Cisco Systems, Inc. and Seagate Technology Holdings plc
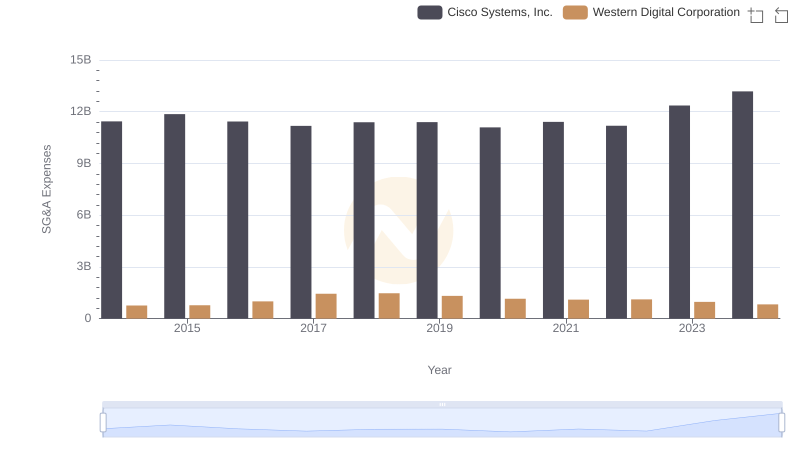
Breaking Down SG&A Expenses: Cisco Systems, Inc. vs Western Digital Corporation
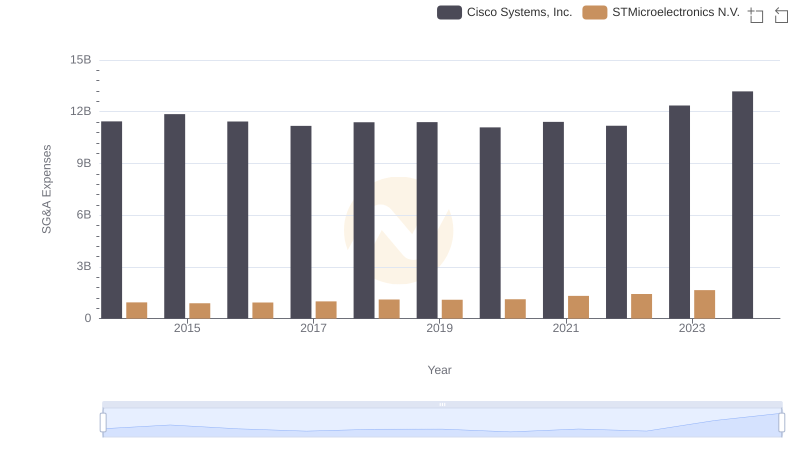
Operational Costs Compared: SG&A Analysis of Cisco Systems, Inc. and STMicroelectronics N.V.
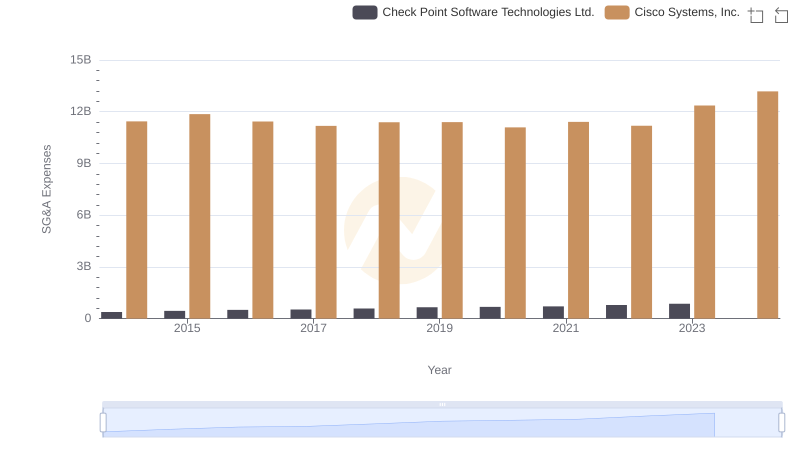
Cisco Systems, Inc. vs Check Point Software Technologies Ltd.: SG&A Expense Trends
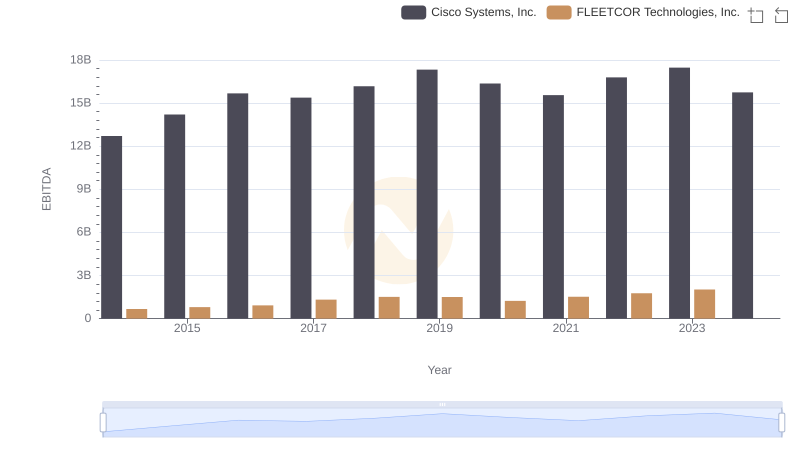
EBITDA Metrics Evaluated: Cisco Systems, Inc. vs FLEETCOR Technologies, Inc.
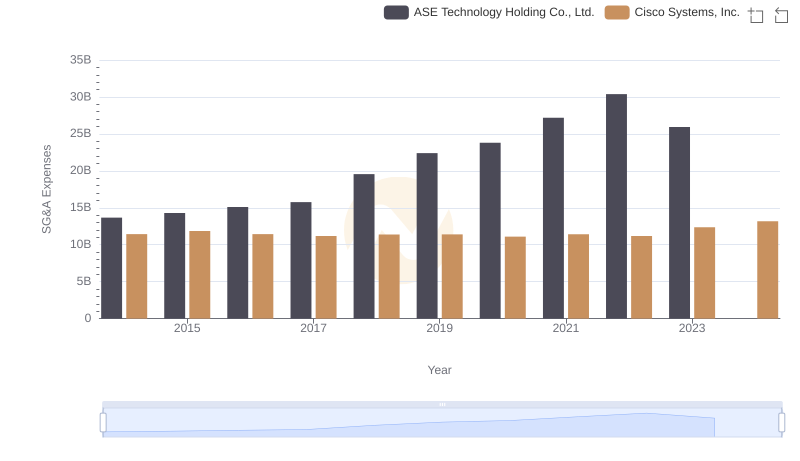
Cost Management Insights: SG&A Expenses for Cisco Systems, Inc. and ASE Technology Holding Co., Ltd.