| __timestamp | Check Point Software Technologies Ltd. | Cisco Systems, Inc. |
|---|---|---|
| Wednesday, January 1, 2014 | 1495816000 | 47142000000 |
| Thursday, January 1, 2015 | 1629838000 | 49161000000 |
| Friday, January 1, 2016 | 1741301000 | 49247000000 |
| Sunday, January 1, 2017 | 1854658000 | 48005000000 |
| Monday, January 1, 2018 | 1916475000 | 49330000000 |
| Tuesday, January 1, 2019 | 1994800000 | 51904000000 |
| Wednesday, January 1, 2020 | 2064900000 | 49301000000 |
| Friday, January 1, 2021 | 2166800000 | 49818000000 |
| Saturday, January 1, 2022 | 2329900000 | 51557000000 |
| Sunday, January 1, 2023 | 2414700000 | 56998000000 |
| Monday, January 1, 2024 | 53803000000 |
Unleashing the power of data
In the ever-evolving tech landscape, Cisco Systems, Inc. and Check Point Software Technologies Ltd. have been pivotal players. Over the past decade, Cisco has consistently outperformed Check Point in terms of revenue, showcasing its dominance in the networking sector. From 2014 to 2023, Cisco's revenue surged by approximately 21%, peaking at $57 billion in 2023. In contrast, Check Point's revenue grew by around 61% during the same period, reaching $2.4 billion. Despite the smaller scale, Check Point's growth trajectory highlights its resilience and strategic positioning in cybersecurity. Notably, 2024 data for Check Point is missing, indicating potential reporting delays or strategic shifts. This comparison underscores the dynamic nature of the tech industry, where giants like Cisco continue to expand, while specialized firms like Check Point carve out significant niches.
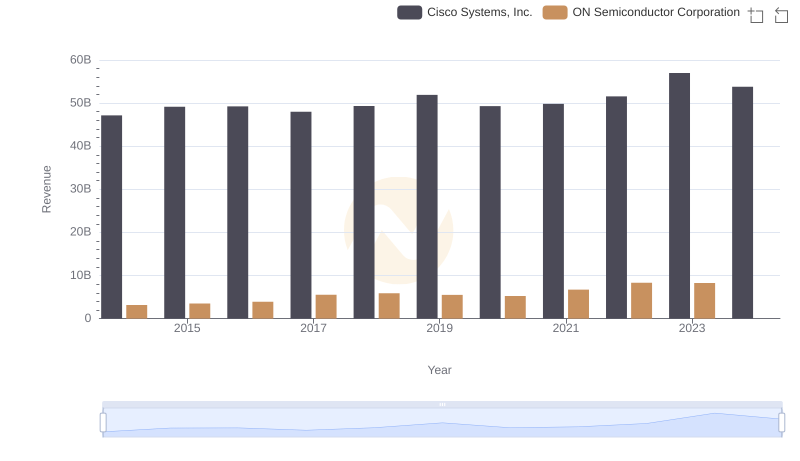
Cisco Systems, Inc. vs ON Semiconductor Corporation: Annual Revenue Growth Compared
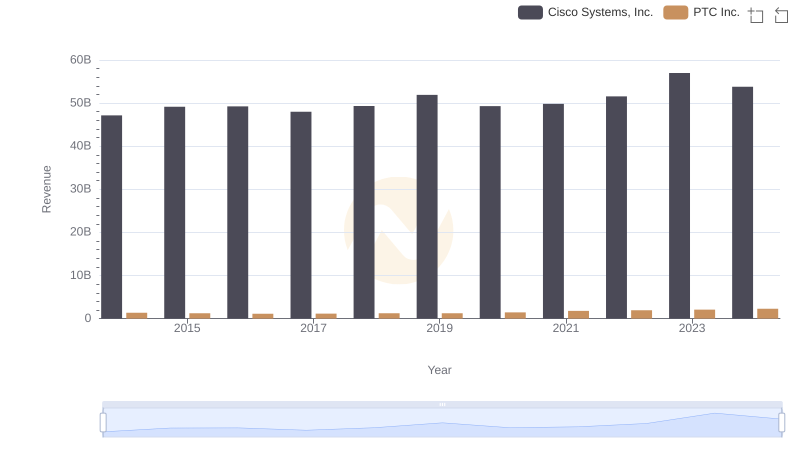
Cisco Systems, Inc. and PTC Inc.: A Comprehensive Revenue Analysis
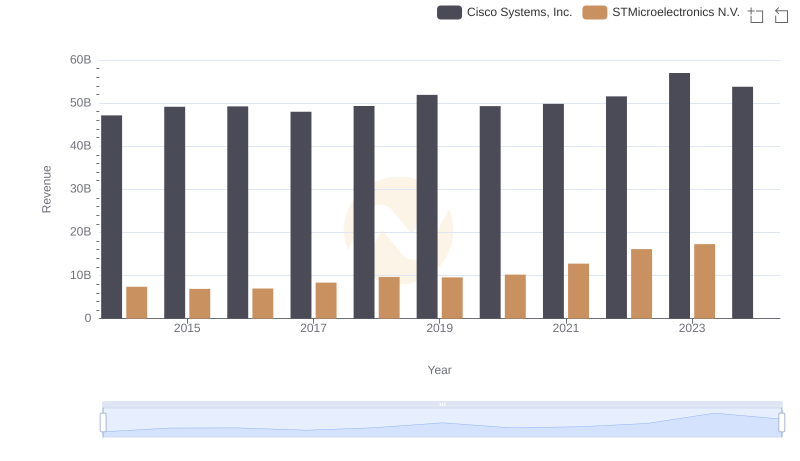
Cisco Systems, Inc. vs STMicroelectronics N.V.: Annual Revenue Growth Compared
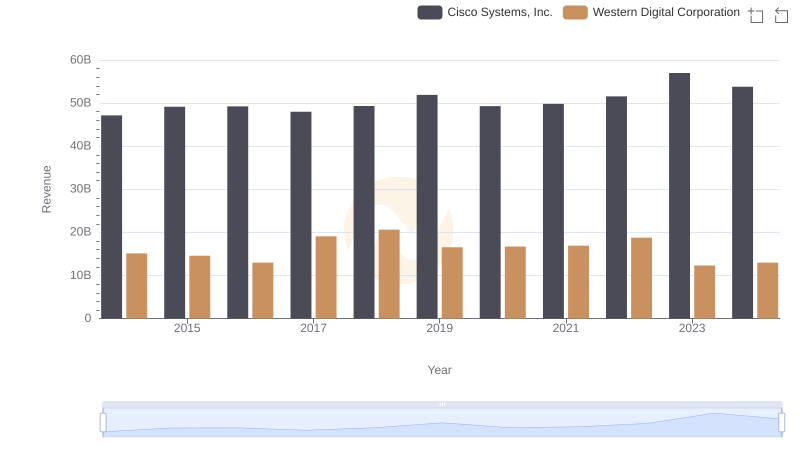
Who Generates More Revenue? Cisco Systems, Inc. or Western Digital Corporation
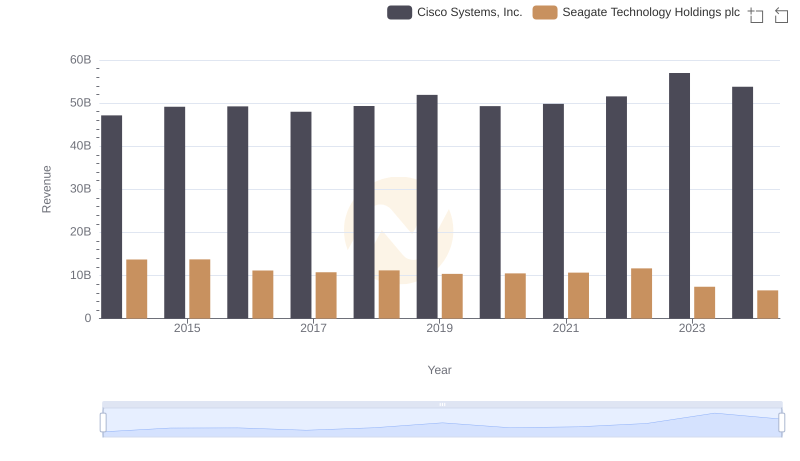
Cisco Systems, Inc. vs Seagate Technology Holdings plc: Examining Key Revenue Metrics
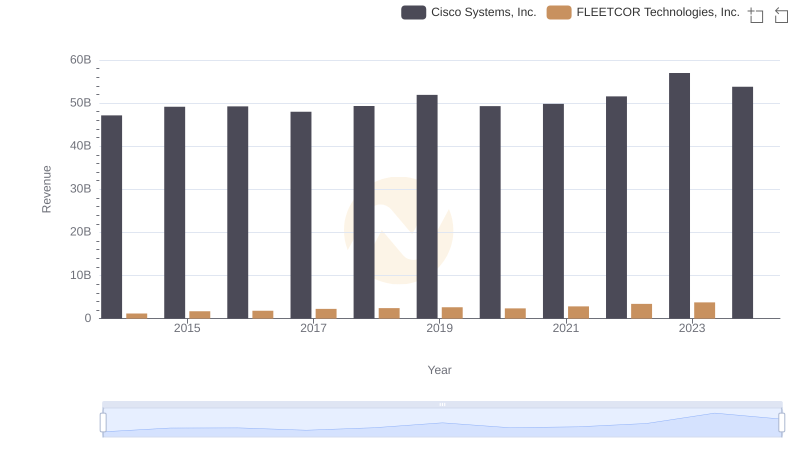
Revenue Insights: Cisco Systems, Inc. and FLEETCOR Technologies, Inc. Performance Compared
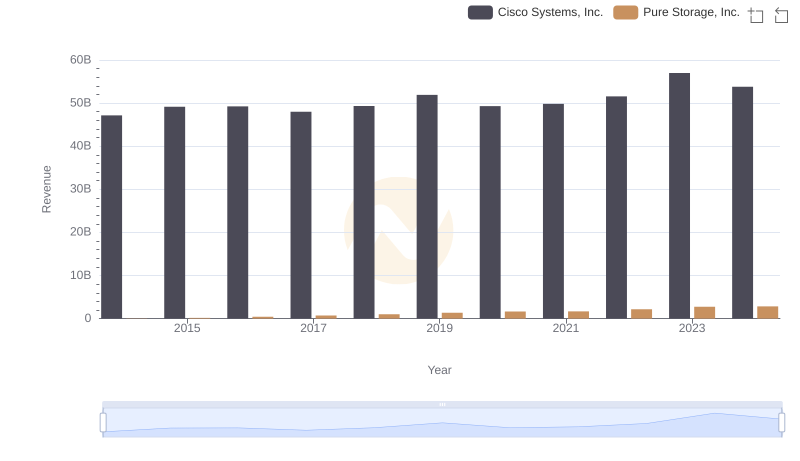
Breaking Down Revenue Trends: Cisco Systems, Inc. vs Pure Storage, Inc.
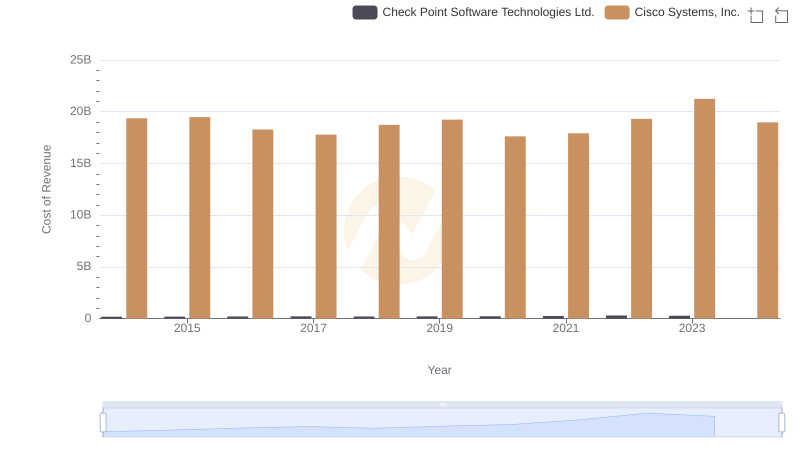
Cisco Systems, Inc. vs Check Point Software Technologies Ltd.: Efficiency in Cost of Revenue Explored
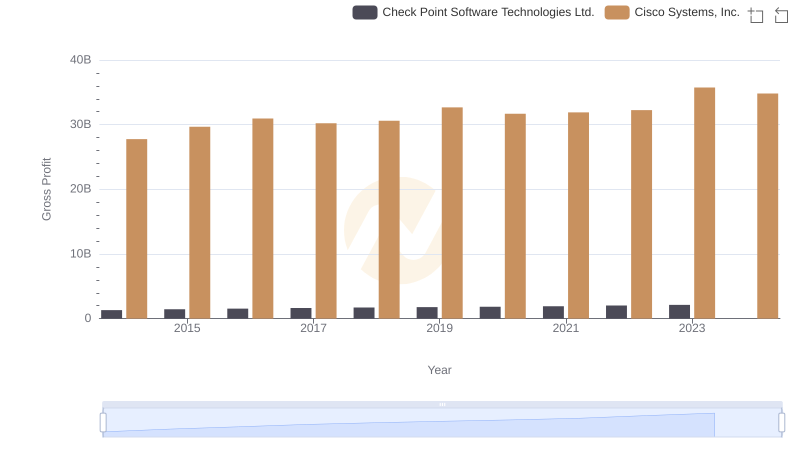
Key Insights on Gross Profit: Cisco Systems, Inc. vs Check Point Software Technologies Ltd.
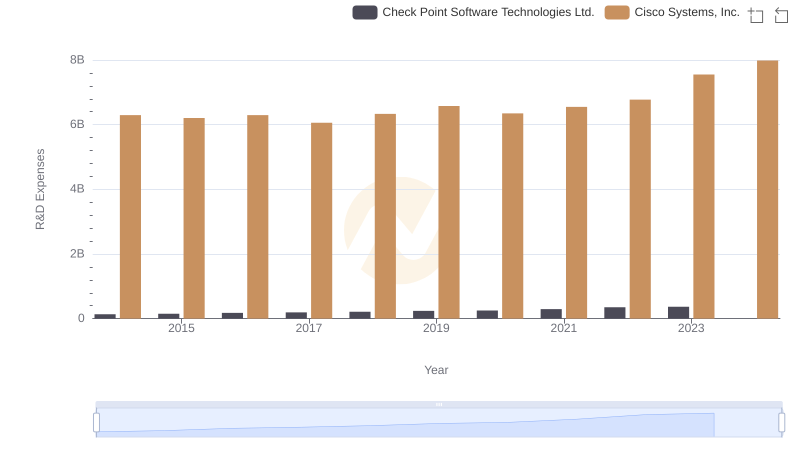
Cisco Systems, Inc. vs Check Point Software Technologies Ltd.: Strategic Focus on R&D Spending
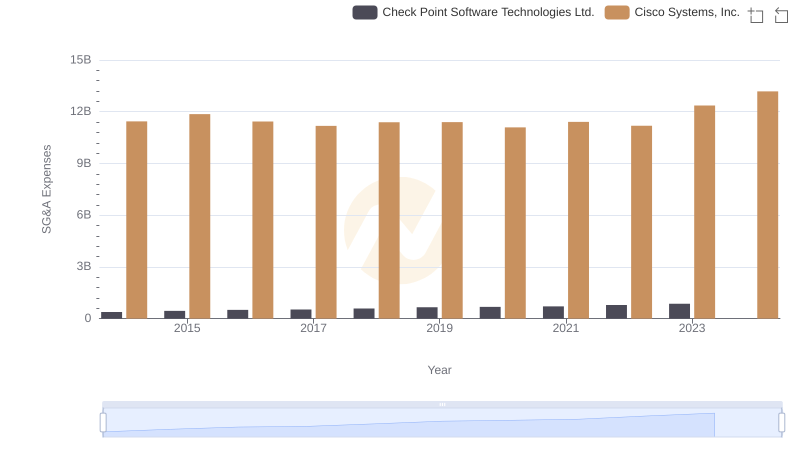
Cisco Systems, Inc. vs Check Point Software Technologies Ltd.: SG&A Expense Trends
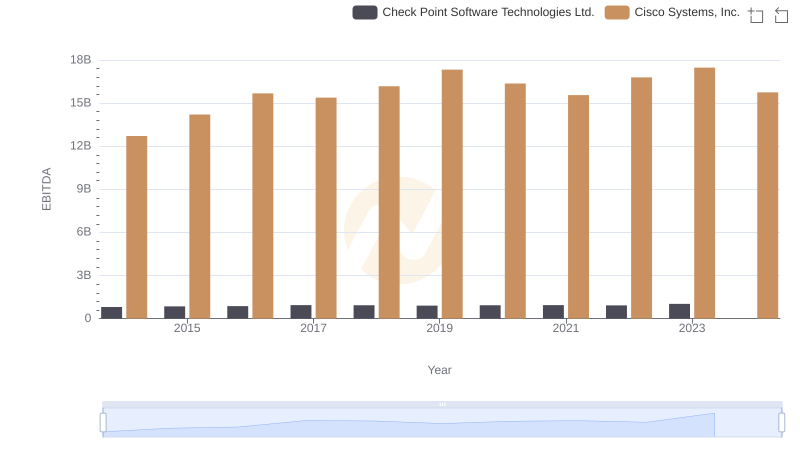
Comparative EBITDA Analysis: Cisco Systems, Inc. vs Check Point Software Technologies Ltd.