| __timestamp | Cisco Systems, Inc. | Ubiquiti Inc. |
|---|---|---|
| Wednesday, January 1, 2014 | 27769000000 | 253467000 |
| Thursday, January 1, 2015 | 29681000000 | 262187000 |
| Friday, January 1, 2016 | 30960000000 | 324795000 |
| Sunday, January 1, 2017 | 30224000000 | 395708000 |
| Monday, January 1, 2018 | 30606000000 | 443572000 |
| Tuesday, January 1, 2019 | 32666000000 | 537604000 |
| Wednesday, January 1, 2020 | 31683000000 | 608172000 |
| Friday, January 1, 2021 | 31894000000 | 912276000 |
| Saturday, January 1, 2022 | 32248000000 | 669812000 |
| Sunday, January 1, 2023 | 35753000000 | 760731000 |
| Monday, January 1, 2024 | 34828000000 | 739762000 |
Unleashing the power of data
In the ever-evolving tech landscape, Cisco Systems, Inc. and Ubiquiti Inc. have carved distinct paths. From 2014 to 2024, Cisco's gross profit has shown a steady upward trajectory, peaking in 2023 with a remarkable 29% increase from 2014. This growth underscores Cisco's robust market presence and strategic innovations. Meanwhile, Ubiquiti, though smaller in scale, has demonstrated impressive growth, with its gross profit surging by over 190% during the same period. This highlights Ubiquiti's agility and niche market focus. The data reveals a fascinating contrast: while Cisco's profits are consistently high, Ubiquiti's rapid growth rate showcases its potential to disrupt the market. As we look to the future, these trends offer valuable insights into the competitive dynamics of the tech industry.
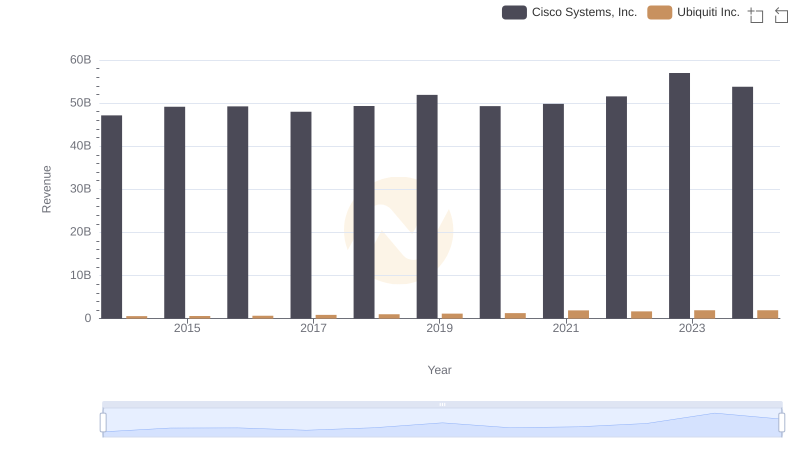
Revenue Insights: Cisco Systems, Inc. and Ubiquiti Inc. Performance Compared
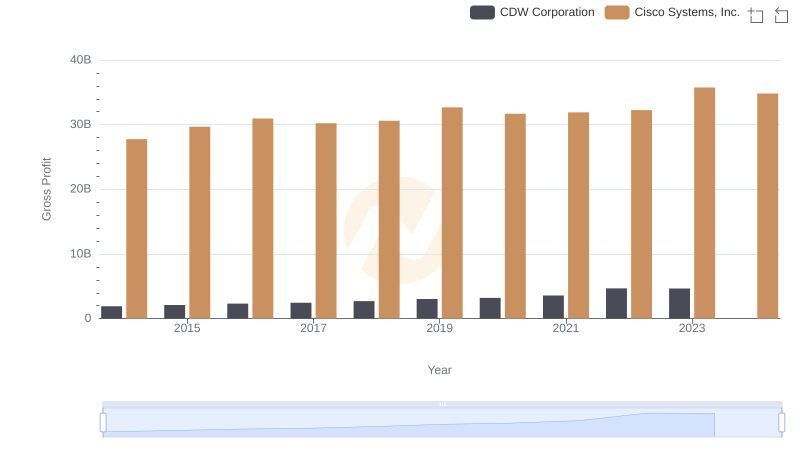
Cisco Systems, Inc. vs CDW Corporation: A Gross Profit Performance Breakdown
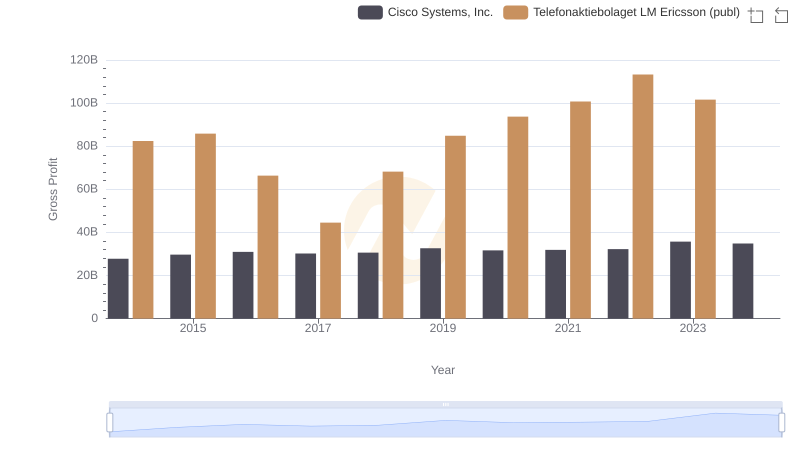
Cisco Systems, Inc. vs Telefonaktiebolaget LM Ericsson (publ): A Gross Profit Performance Breakdown
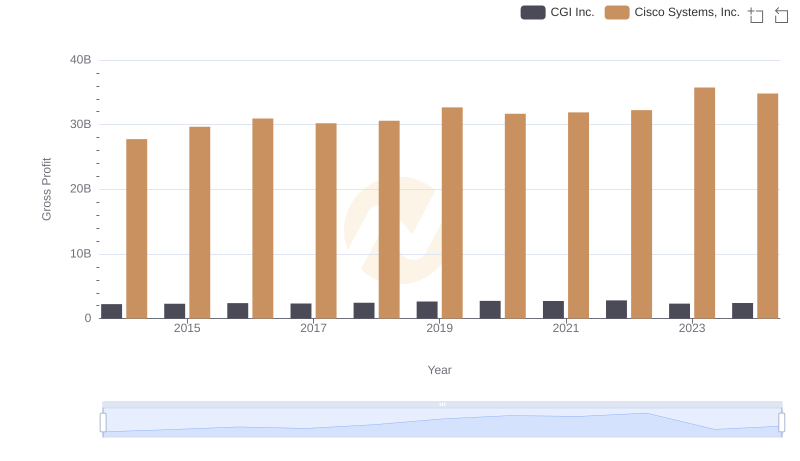
Key Insights on Gross Profit: Cisco Systems, Inc. vs CGI Inc.
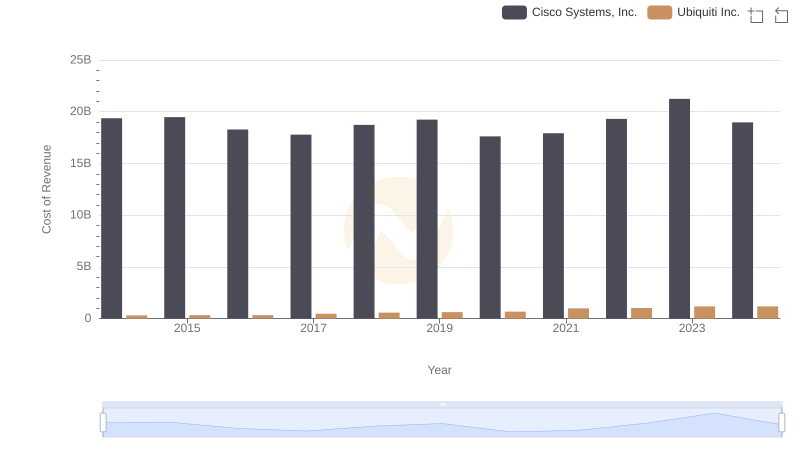
Cost of Revenue Trends: Cisco Systems, Inc. vs Ubiquiti Inc.
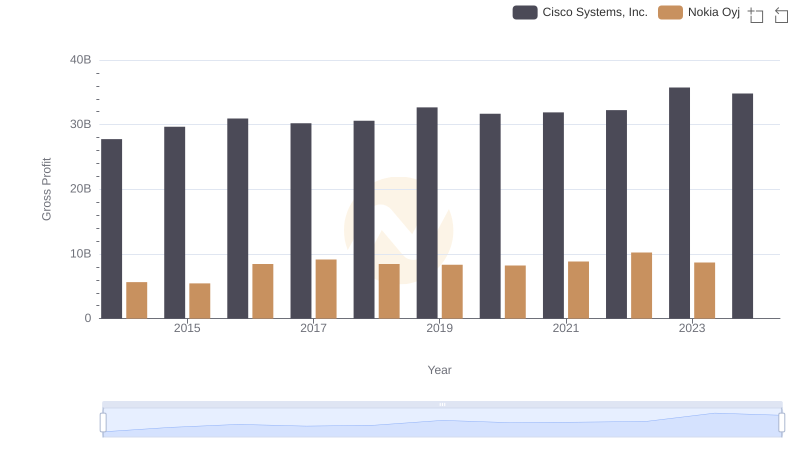
Gross Profit Comparison: Cisco Systems, Inc. and Nokia Oyj Trends
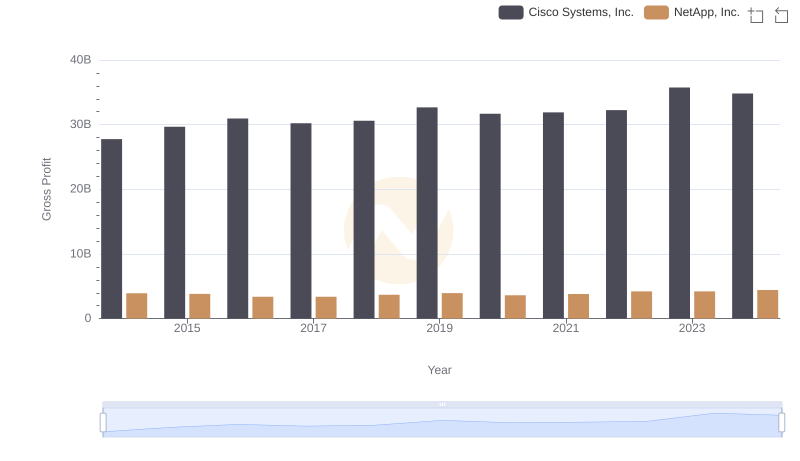
Gross Profit Analysis: Comparing Cisco Systems, Inc. and NetApp, Inc.
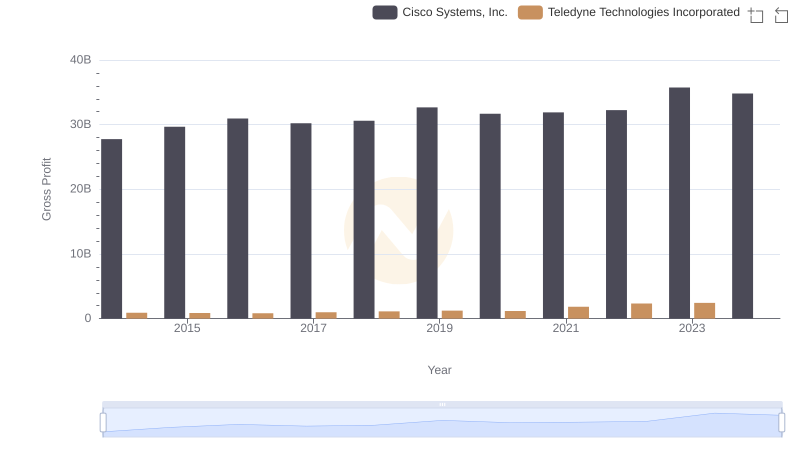
Gross Profit Trends Compared: Cisco Systems, Inc. vs Teledyne Technologies Incorporated
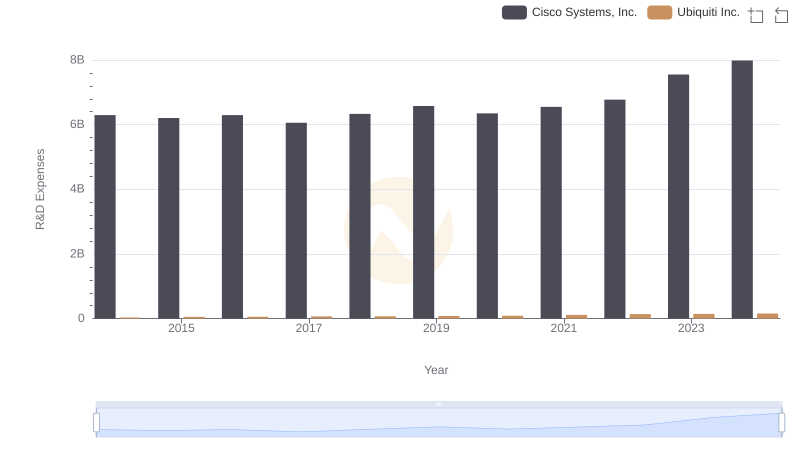
R&D Spending Showdown: Cisco Systems, Inc. vs Ubiquiti Inc.
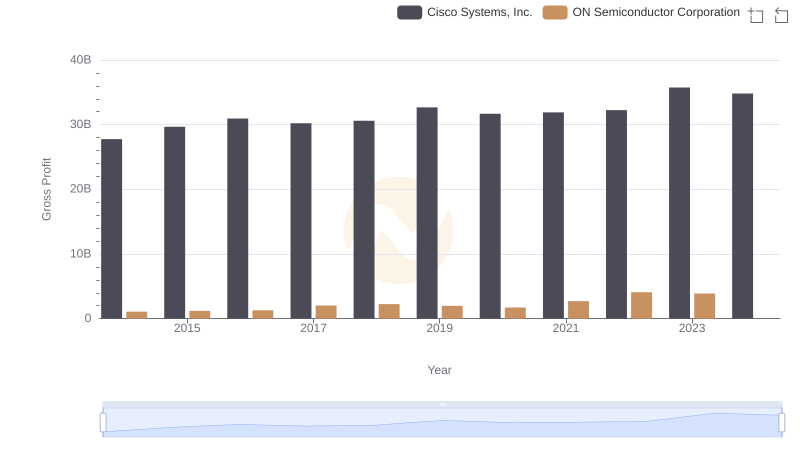
Gross Profit Analysis: Comparing Cisco Systems, Inc. and ON Semiconductor Corporation
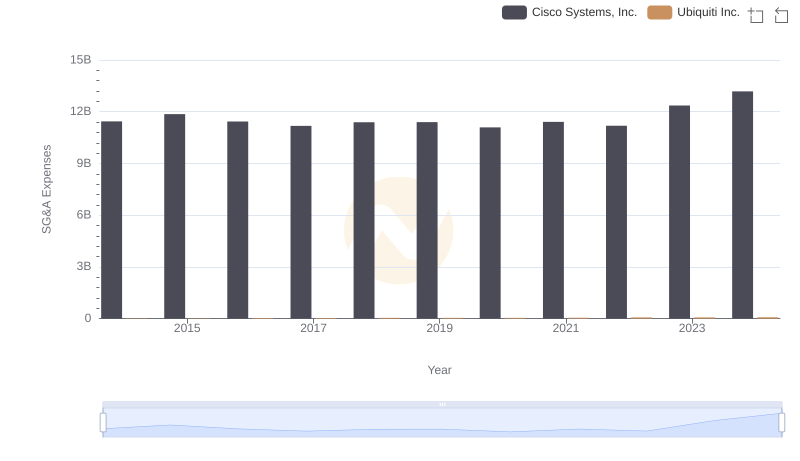
Cisco Systems, Inc. vs Ubiquiti Inc.: SG&A Expense Trends
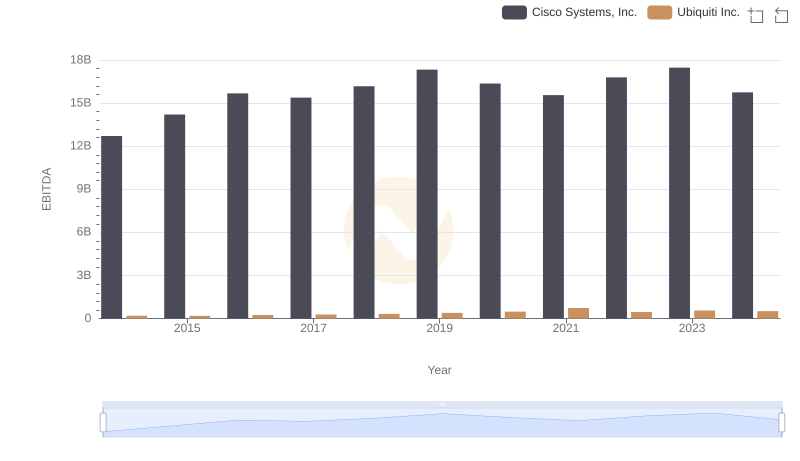
Comprehensive EBITDA Comparison: Cisco Systems, Inc. vs Ubiquiti Inc.