| __timestamp | Cisco Systems, Inc. | Microchip Technology Incorporated |
|---|---|---|
| Wednesday, January 1, 2014 | 11437000000 | 267278000 |
| Thursday, January 1, 2015 | 11861000000 | 274815000 |
| Friday, January 1, 2016 | 11433000000 | 301670000 |
| Sunday, January 1, 2017 | 11177000000 | 499811000 |
| Monday, January 1, 2018 | 11386000000 | 452100000 |
| Tuesday, January 1, 2019 | 11398000000 | 682900000 |
| Wednesday, January 1, 2020 | 11094000000 | 676600000 |
| Friday, January 1, 2021 | 11411000000 | 610300000 |
| Saturday, January 1, 2022 | 11186000000 | 718900000 |
| Sunday, January 1, 2023 | 12358000000 | 797700000 |
| Monday, January 1, 2024 | 13177000000 | 734200000 |
Data in motion
In the ever-evolving tech industry, understanding the financial strategies of leading companies is crucial. This analysis delves into the Selling, General, and Administrative (SG&A) expenses of Cisco Systems, Inc. and Microchip Technology Incorporated from 2014 to 2024. Over this decade, Cisco's SG&A expenses have consistently been higher, averaging around 20 times more than Microchip's. Notably, Cisco's expenses peaked in 2024, showing a 15% increase from 2023, while Microchip's expenses saw a 9% rise in the same period. This trend highlights Cisco's expansive operational scale compared to Microchip's more streamlined approach. The data suggests that while both companies are investing in their growth, Cisco's larger financial footprint reflects its broader market reach and strategic investments. As the tech landscape continues to shift, these financial insights offer a glimpse into the operational priorities of these industry giants.

Breaking Down Revenue Trends: Cisco Systems, Inc. vs Microchip Technology Incorporated
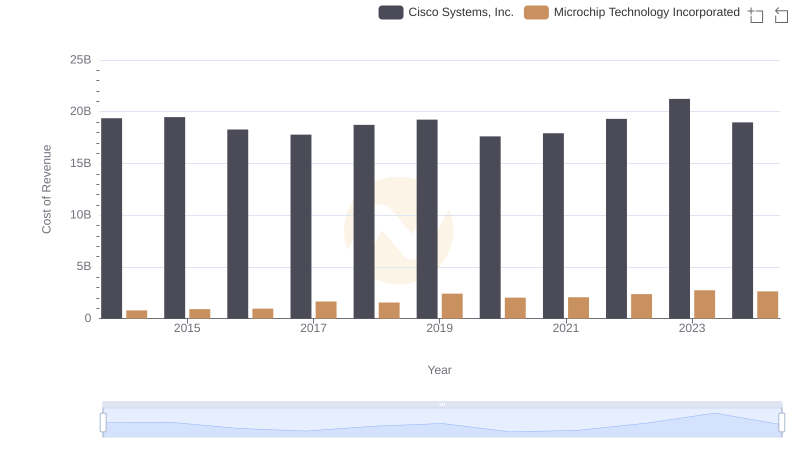
Analyzing Cost of Revenue: Cisco Systems, Inc. and Microchip Technology Incorporated
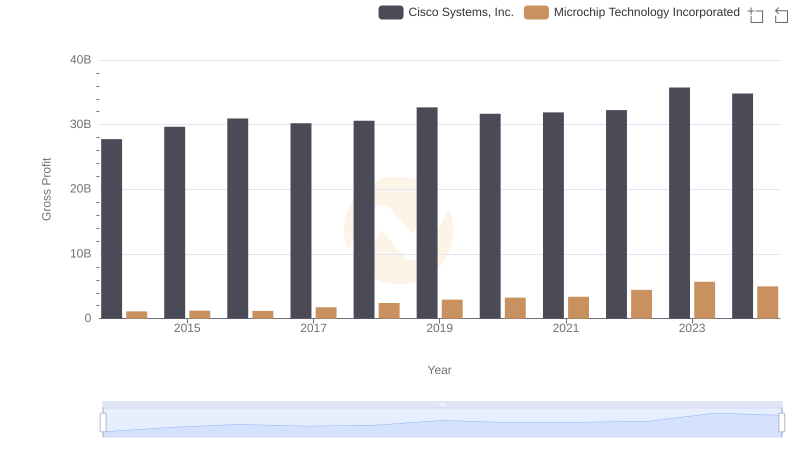
Cisco Systems, Inc. and Microchip Technology Incorporated: A Detailed Gross Profit Analysis
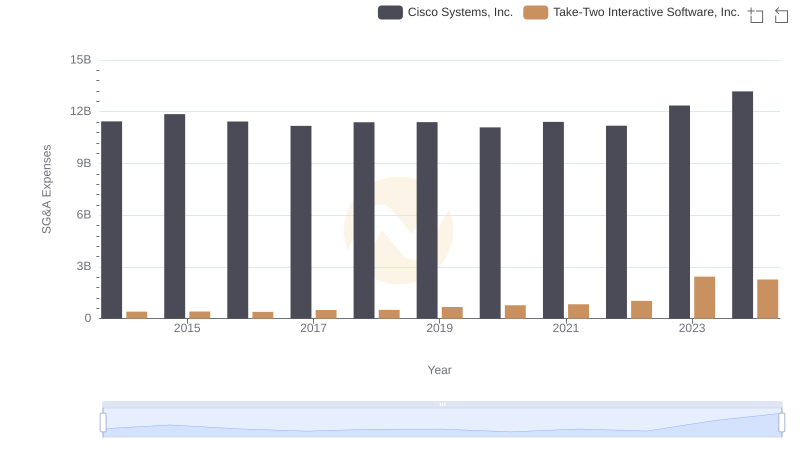
Who Optimizes SG&A Costs Better? Cisco Systems, Inc. or Take-Two Interactive Software, Inc.
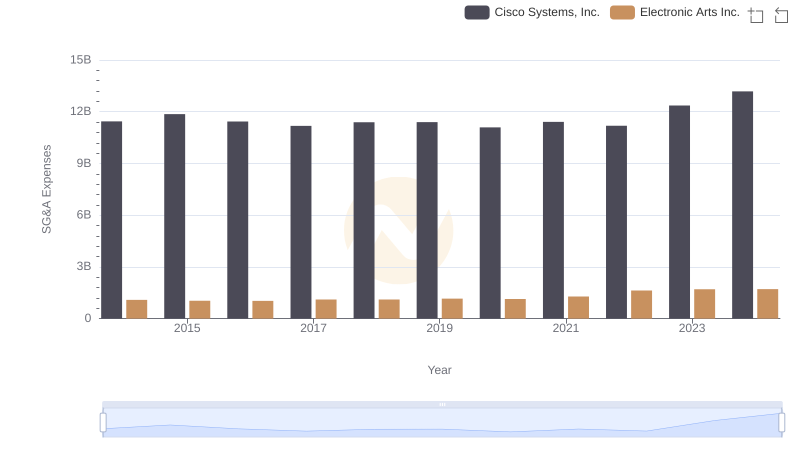
Who Optimizes SG&A Costs Better? Cisco Systems, Inc. or Electronic Arts Inc.
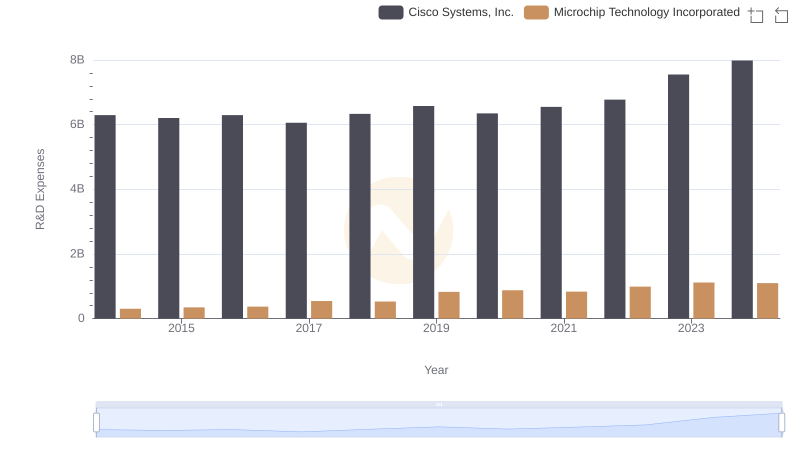
Analyzing R&D Budgets: Cisco Systems, Inc. vs Microchip Technology Incorporated
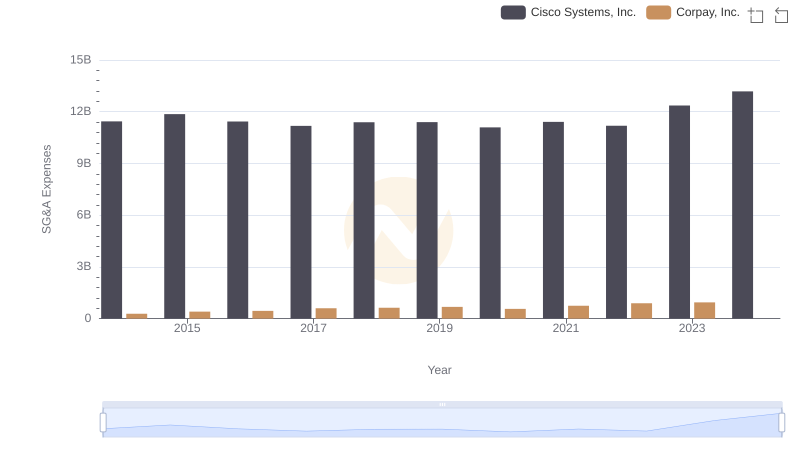
Cisco Systems, Inc. and Corpay, Inc.: SG&A Spending Patterns Compared
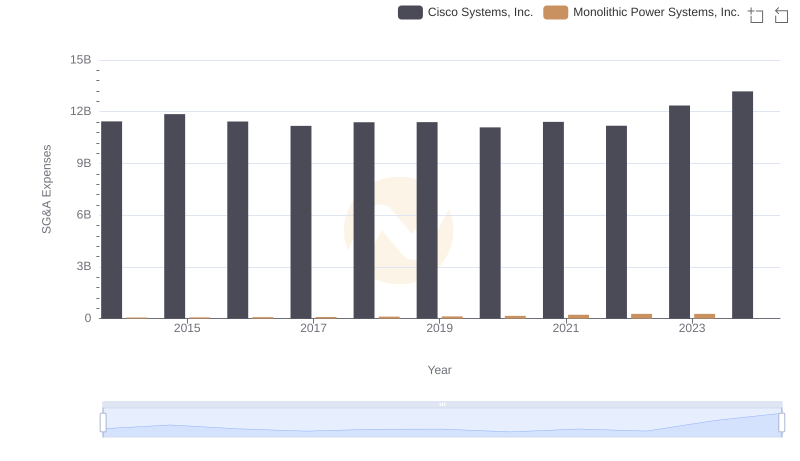
Breaking Down SG&A Expenses: Cisco Systems, Inc. vs Monolithic Power Systems, Inc.
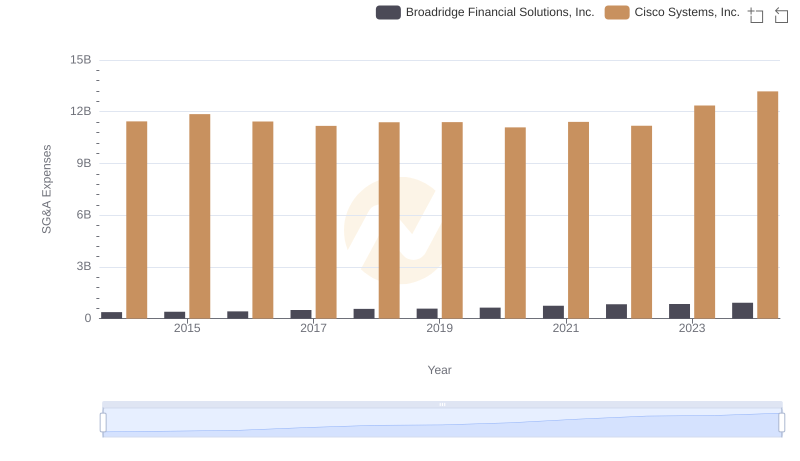
Breaking Down SG&A Expenses: Cisco Systems, Inc. vs Broadridge Financial Solutions, Inc.
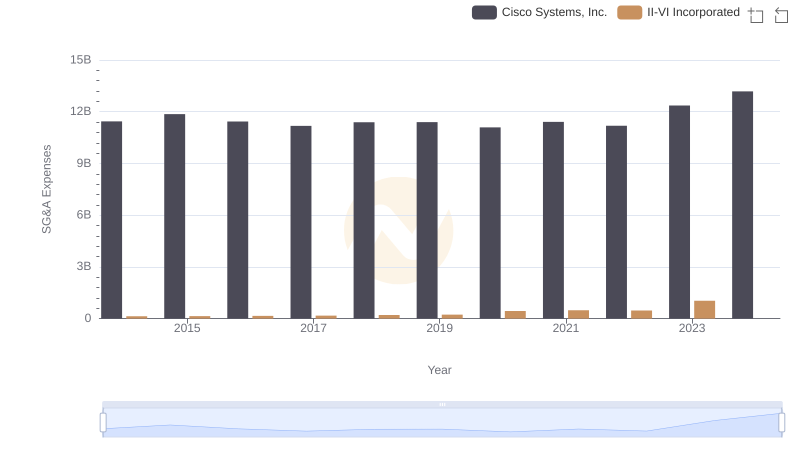
Operational Costs Compared: SG&A Analysis of Cisco Systems, Inc. and II-VI Incorporated
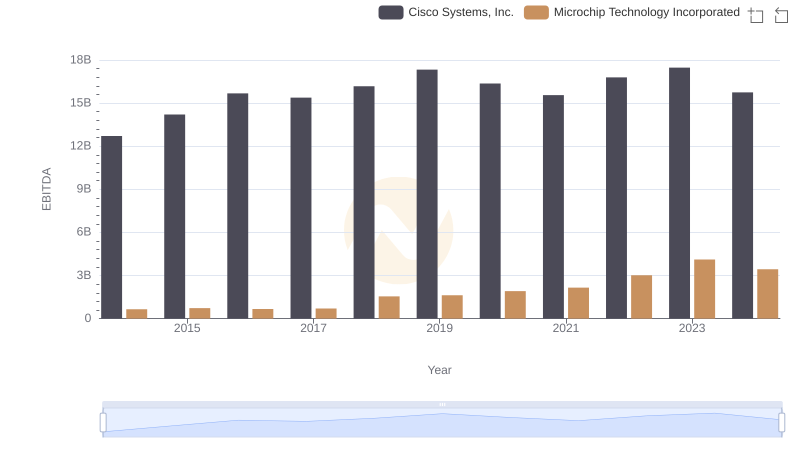
A Side-by-Side Analysis of EBITDA: Cisco Systems, Inc. and Microchip Technology Incorporated
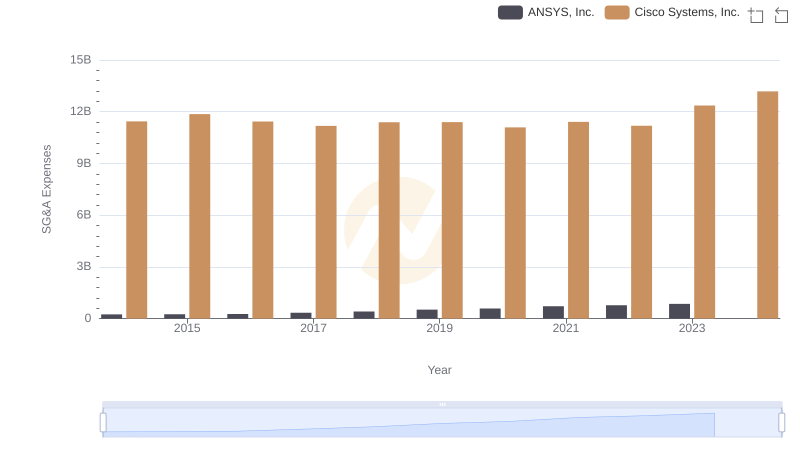
Cisco Systems, Inc. vs ANSYS, Inc.: SG&A Expense Trends