| __timestamp | Cintas Corporation | Pentair plc |
|---|---|---|
| Wednesday, January 1, 2014 | 2637426000 | 4563000000 |
| Thursday, January 1, 2015 | 2555549000 | 4263200000 |
| Friday, January 1, 2016 | 2775588000 | 3095900000 |
| Sunday, January 1, 2017 | 2943086000 | 3107400000 |
| Monday, January 1, 2018 | 3568109000 | 1917400000 |
| Tuesday, January 1, 2019 | 3763715000 | 1905700000 |
| Wednesday, January 1, 2020 | 3851372000 | 1960200000 |
| Friday, January 1, 2021 | 3801689000 | 2445600000 |
| Saturday, January 1, 2022 | 4222213000 | 2757200000 |
| Sunday, January 1, 2023 | 4642401000 | 2585300000 |
| Monday, January 1, 2024 | 4910199000 | 2484000000 |
Unleashing the power of data
In the ever-evolving landscape of corporate finance, understanding the cost of revenue is crucial for investors and analysts alike. This metric, which represents the direct costs attributable to the production of goods sold by a company, offers insights into operational efficiency and profitability.
From 2014 to 2023, Cintas Corporation has demonstrated a robust upward trend in its cost of revenue, growing by approximately 86%, from $2.64 billion to $4.91 billion. This increase reflects Cintas's expanding operations and market reach. In contrast, Pentair plc's cost of revenue has shown a more volatile pattern, peaking in 2014 and then declining by about 43% to $2.59 billion in 2023. This fluctuation may indicate strategic shifts or market challenges faced by Pentair.
The data for 2024 is incomplete, highlighting the dynamic nature of financial forecasting and the need for continuous analysis.
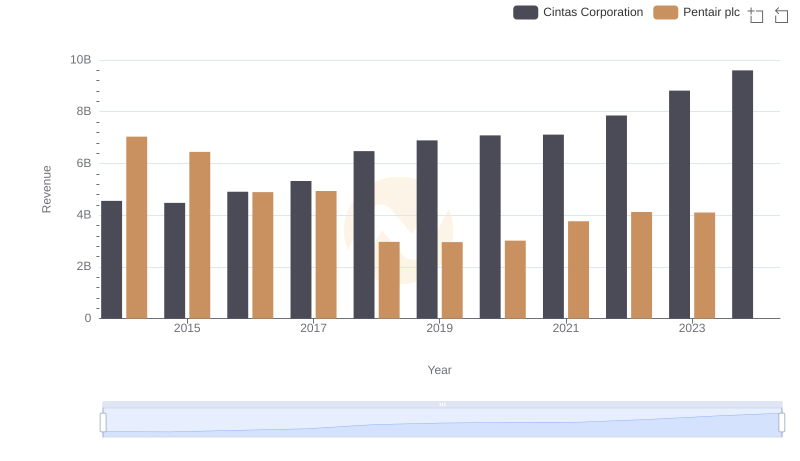
Annual Revenue Comparison: Cintas Corporation vs Pentair plc
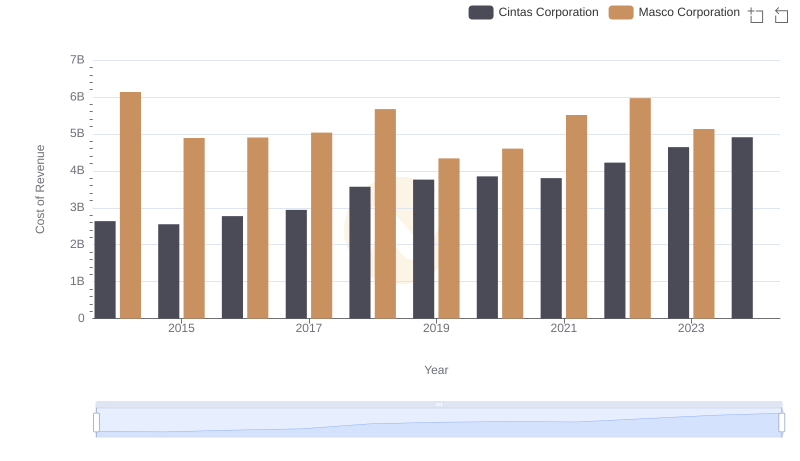
Comparing Cost of Revenue Efficiency: Cintas Corporation vs Masco Corporation
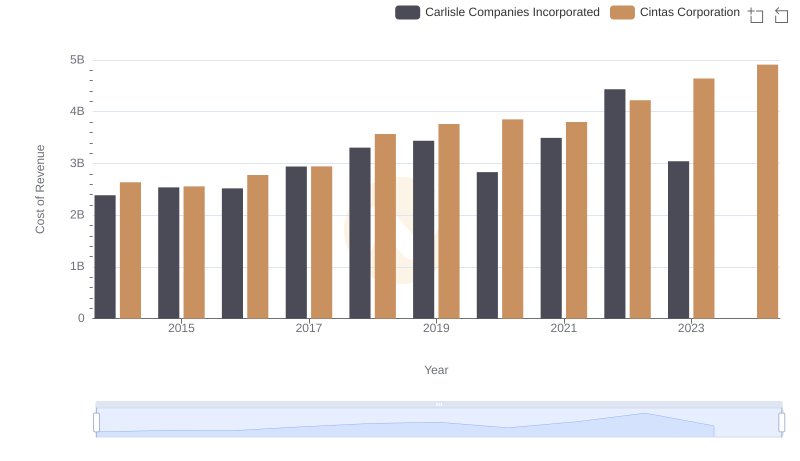
Cost of Revenue: Key Insights for Cintas Corporation and Carlisle Companies Incorporated
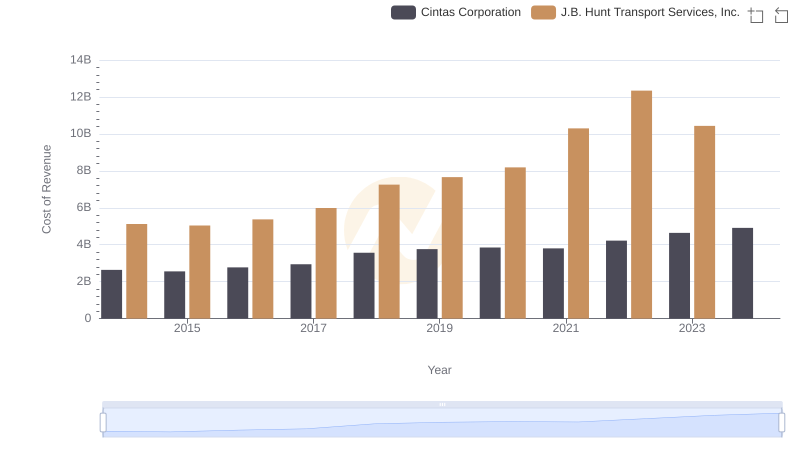
Cintas Corporation vs J.B. Hunt Transport Services, Inc.: Efficiency in Cost of Revenue Explored
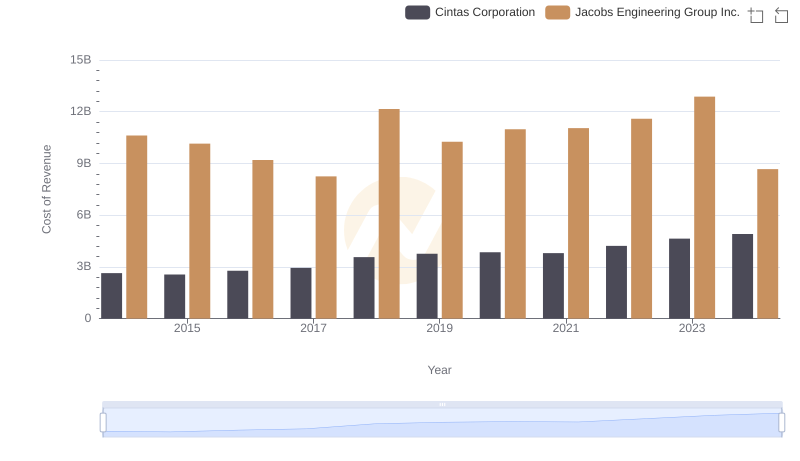
Cintas Corporation vs Jacobs Engineering Group Inc.: Efficiency in Cost of Revenue Explored
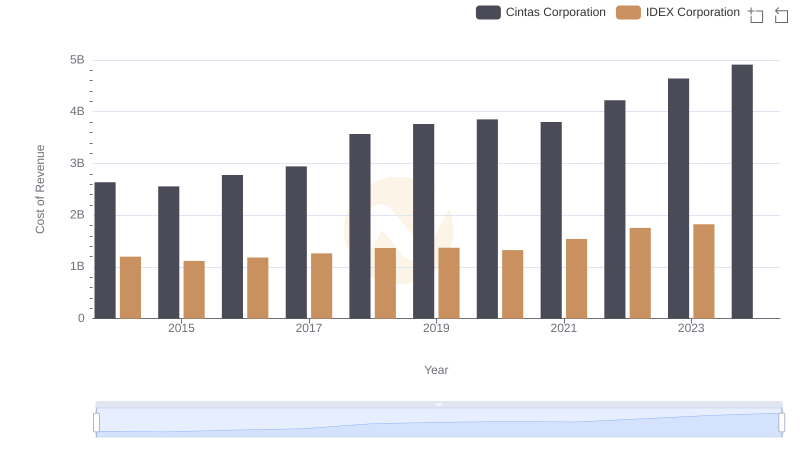
Cintas Corporation vs IDEX Corporation: Efficiency in Cost of Revenue Explored
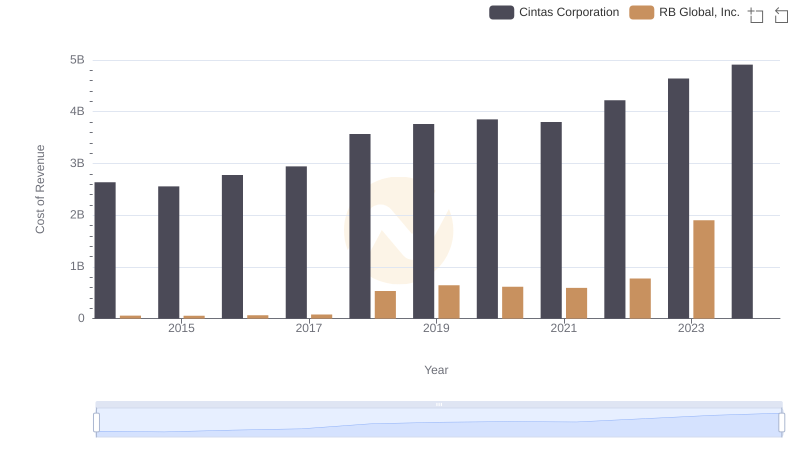
Cintas Corporation vs RB Global, Inc.: Efficiency in Cost of Revenue Explored
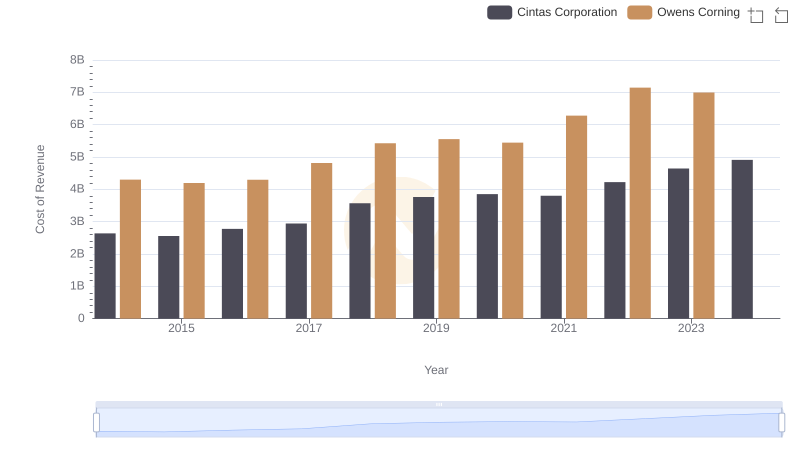
Analyzing Cost of Revenue: Cintas Corporation and Owens Corning
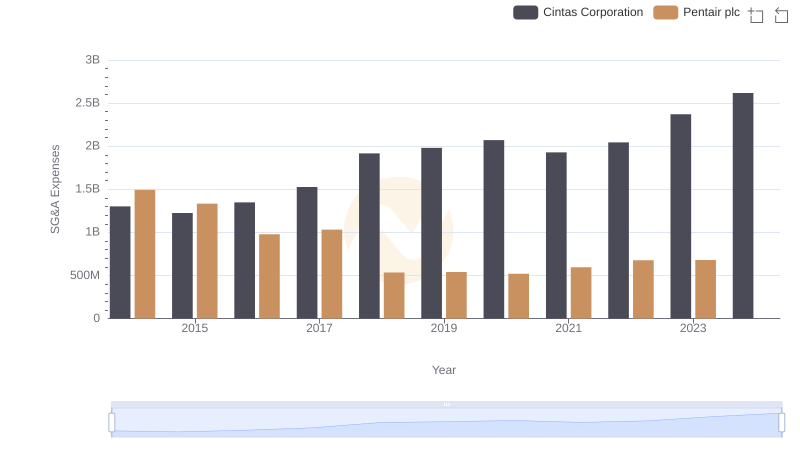
Breaking Down SG&A Expenses: Cintas Corporation vs Pentair plc
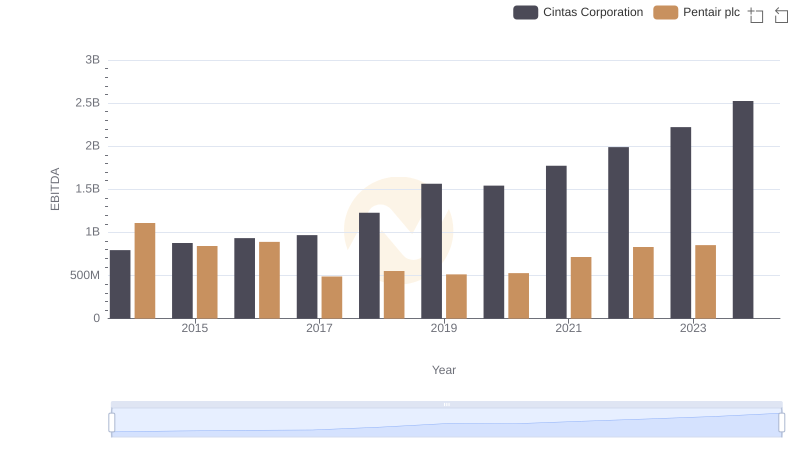
Professional EBITDA Benchmarking: Cintas Corporation vs Pentair plc