| __timestamp | Cintas Corporation | Masco Corporation |
|---|---|---|
| Wednesday, January 1, 2014 | 1914386000 | 2387000000 |
| Thursday, January 1, 2015 | 1921337000 | 2253000000 |
| Friday, January 1, 2016 | 2129870000 | 2456000000 |
| Sunday, January 1, 2017 | 2380295000 | 2611000000 |
| Monday, January 1, 2018 | 2908523000 | 2689000000 |
| Tuesday, January 1, 2019 | 3128588000 | 2371000000 |
| Wednesday, January 1, 2020 | 3233748000 | 2587000000 |
| Friday, January 1, 2021 | 3314651000 | 2863000000 |
| Saturday, January 1, 2022 | 3632246000 | 2713000000 |
| Sunday, January 1, 2023 | 4173368000 | 2836000000 |
| Monday, January 1, 2024 | 4686416000 | 2831000000 |
Cracking the code
In the competitive landscape of corporate America, understanding the financial health of companies is crucial. This analysis delves into the gross profit trends of Cintas Corporation and Masco Corporation from 2014 to 2023. Over this decade, Cintas has shown a remarkable growth trajectory, with its gross profit increasing by approximately 145%, from $1.9 billion in 2014 to an impressive $4.2 billion in 2023. In contrast, Masco's growth has been more modest, with a 19% increase, peaking at $2.9 billion in 2021. Notably, Cintas consistently outperformed Masco, especially in recent years, highlighting its robust business model and market strategy. The data for 2024 is incomplete, but the trend suggests Cintas's continued dominance. This comparison offers valuable insights for investors and stakeholders looking to understand the dynamics of these two industry giants.
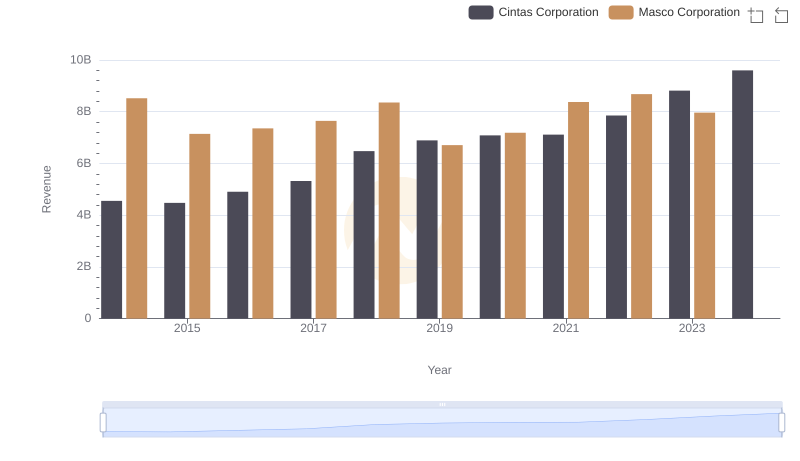
Who Generates More Revenue? Cintas Corporation or Masco Corporation
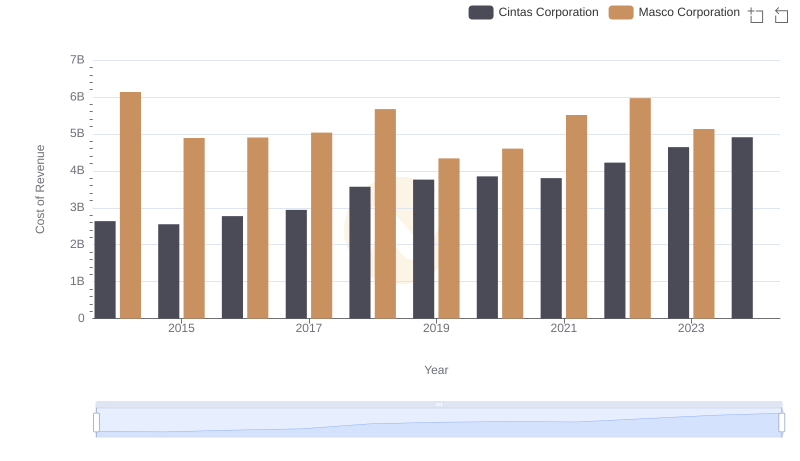
Comparing Cost of Revenue Efficiency: Cintas Corporation vs Masco Corporation
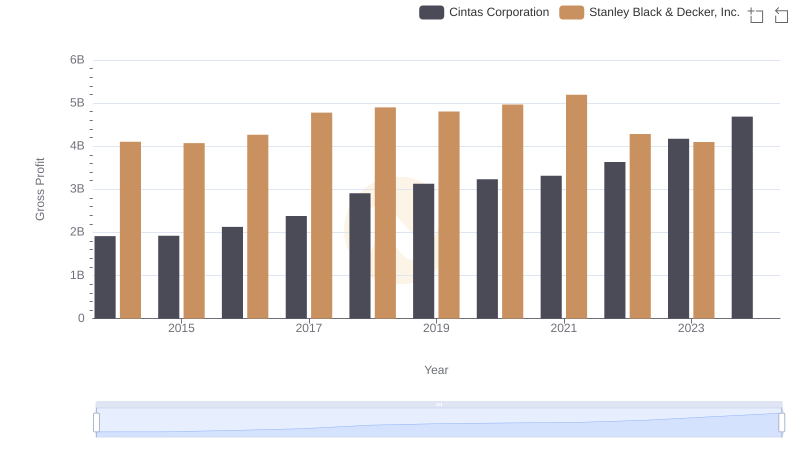
Key Insights on Gross Profit: Cintas Corporation vs Stanley Black & Decker, Inc.
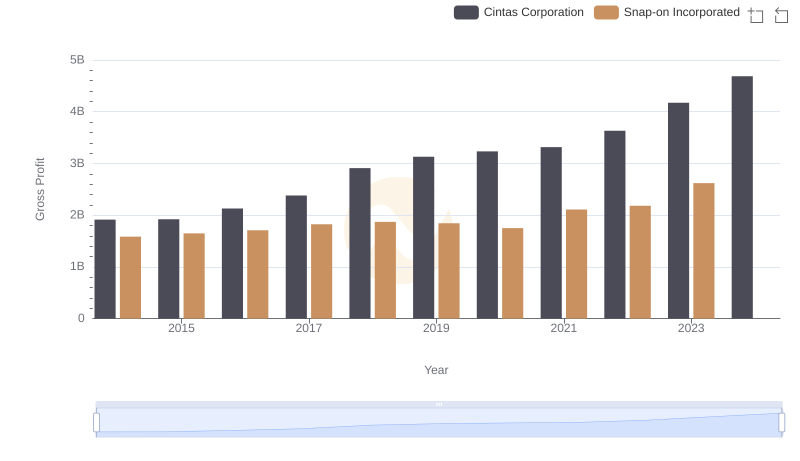
Gross Profit Trends Compared: Cintas Corporation vs Snap-on Incorporated
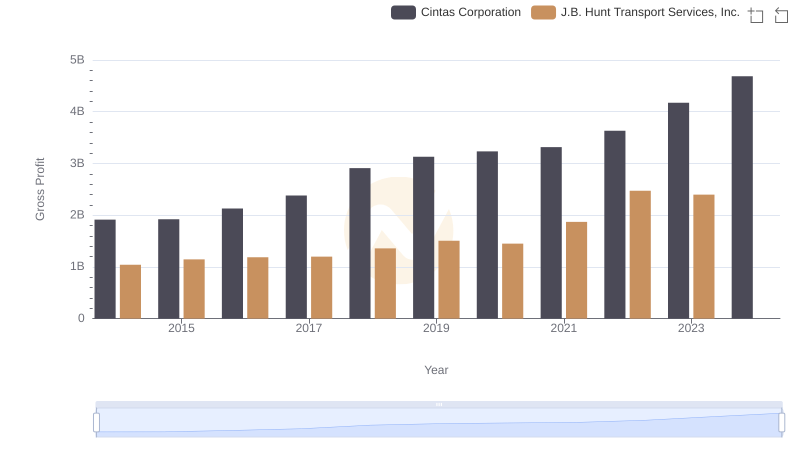
Cintas Corporation and J.B. Hunt Transport Services, Inc.: A Detailed Gross Profit Analysis
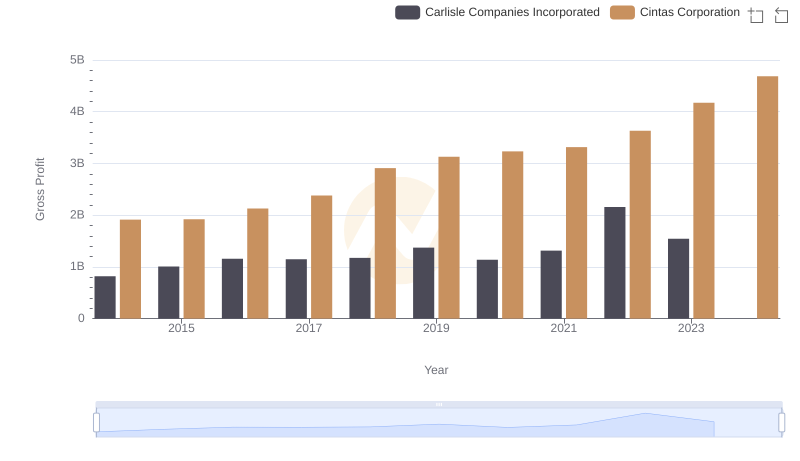
Gross Profit Comparison: Cintas Corporation and Carlisle Companies Incorporated Trends
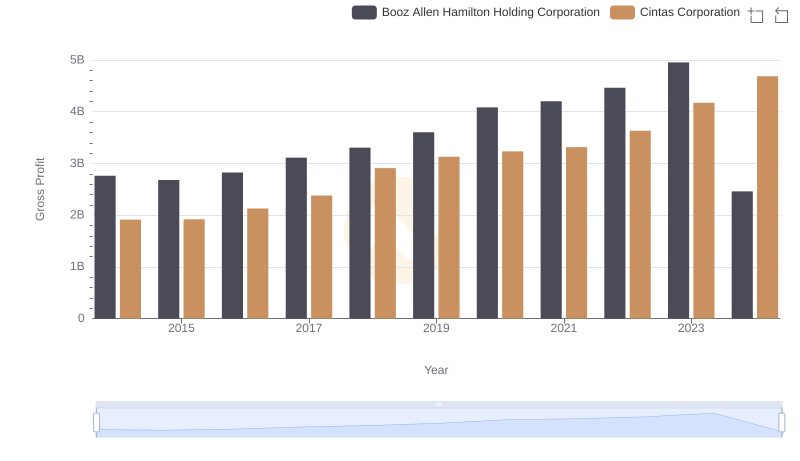
Cintas Corporation and Booz Allen Hamilton Holding Corporation: A Detailed Gross Profit Analysis
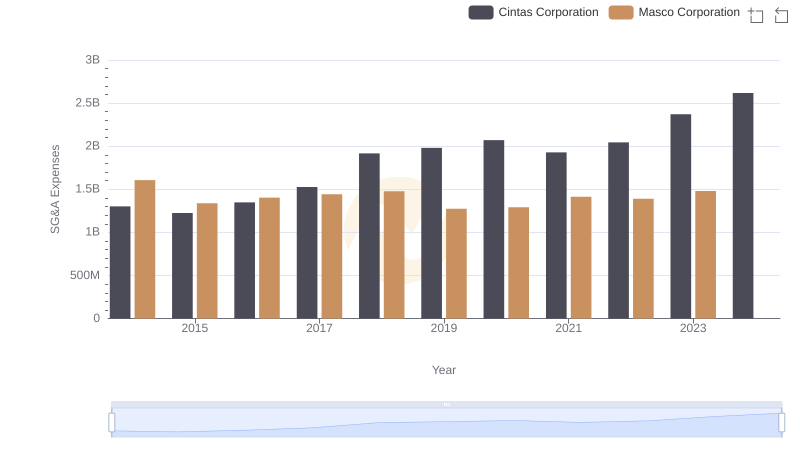
Cintas Corporation vs Masco Corporation: SG&A Expense Trends
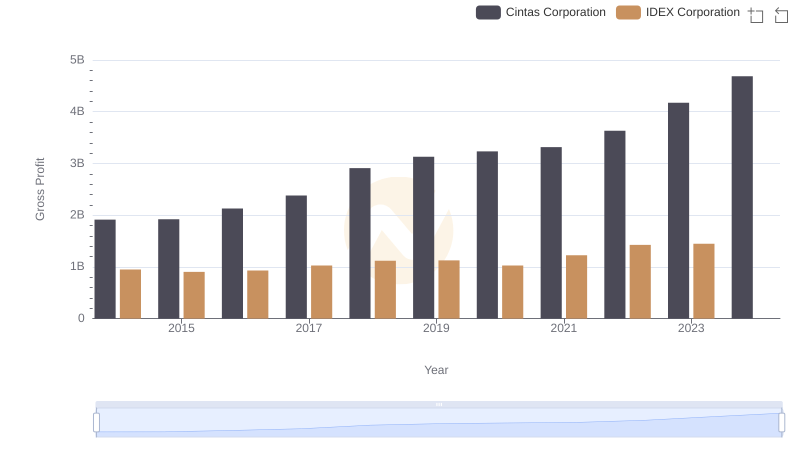
Gross Profit Trends Compared: Cintas Corporation vs IDEX Corporation
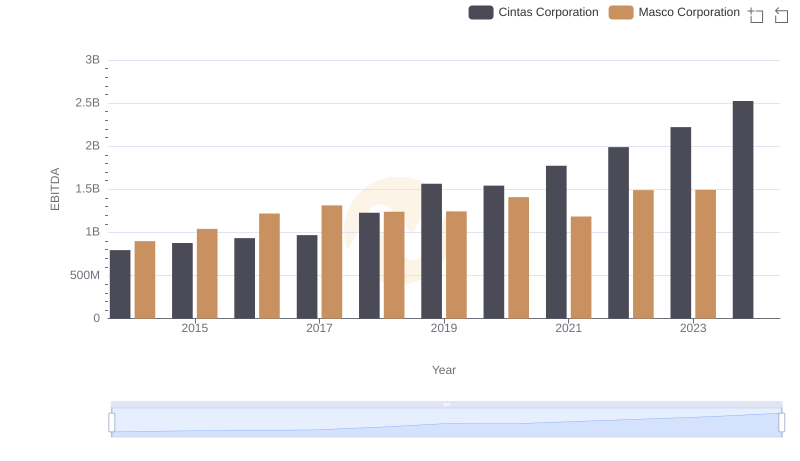
Cintas Corporation and Masco Corporation: A Detailed Examination of EBITDA Performance