| __timestamp | Snap-on Incorporated | United Airlines Holdings, Inc. |
|---|---|---|
| Wednesday, January 1, 2014 | 1047900000 | 1373000000 |
| Thursday, January 1, 2015 | 1009100000 | 1342000000 |
| Friday, January 1, 2016 | 1001400000 | 1303000000 |
| Sunday, January 1, 2017 | 1101300000 | 1349000000 |
| Monday, January 1, 2018 | 1080700000 | 1558000000 |
| Tuesday, January 1, 2019 | 1071500000 | 1651000000 |
| Wednesday, January 1, 2020 | 1054800000 | 459000000 |
| Friday, January 1, 2021 | 1202300000 | 677000000 |
| Saturday, January 1, 2022 | 1181200000 | 1535000000 |
| Sunday, January 1, 2023 | 1249000000 | 1977000000 |
| Monday, January 1, 2024 | 0 | 2231000000 |
Unlocking the unknown
In the ever-evolving landscape of corporate finance, understanding Selling, General, and Administrative (SG&A) expenses is crucial for evaluating a company's operational efficiency. This analysis juxtaposes United Airlines Holdings, Inc. and Snap-on Incorporated, two industry titans with distinct business models, over a decade from 2014 to 2023.
United Airlines, a leader in the aviation sector, saw its SG&A expenses fluctuate significantly, with a notable dip in 2020, reflecting the pandemic's impact. By 2023, their expenses surged by approximately 330% from the 2020 low, highlighting a robust recovery.
Conversely, Snap-on, a stalwart in the tool manufacturing industry, maintained a more stable SG&A trajectory. Their expenses grew steadily, peaking in 2023 with a 25% increase from 2014. This stability underscores Snap-on's consistent operational strategy.
This comparison offers a window into how different sectors navigate financial challenges and opportunities.
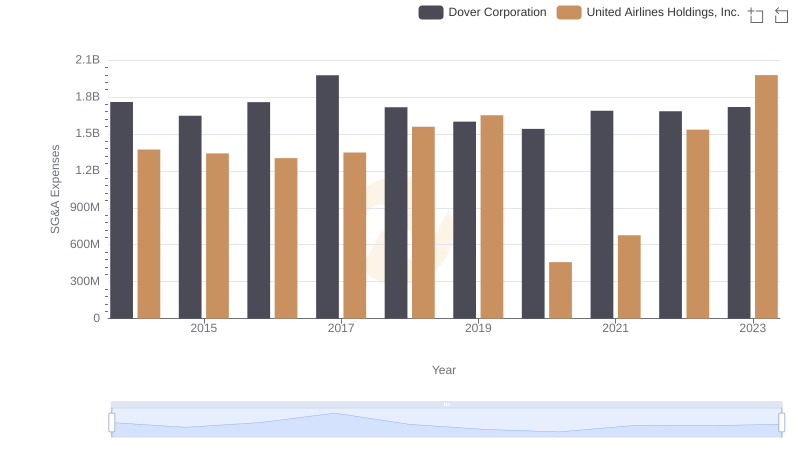
SG&A Efficiency Analysis: Comparing United Airlines Holdings, Inc. and Dover Corporation
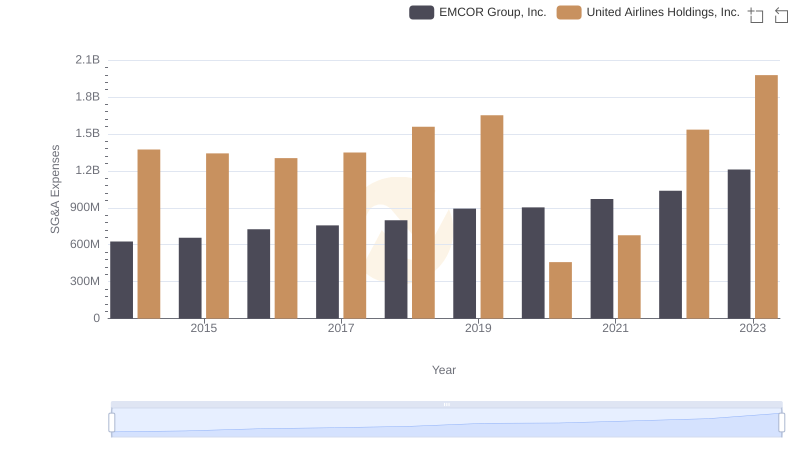
Cost Management Insights: SG&A Expenses for United Airlines Holdings, Inc. and EMCOR Group, Inc.
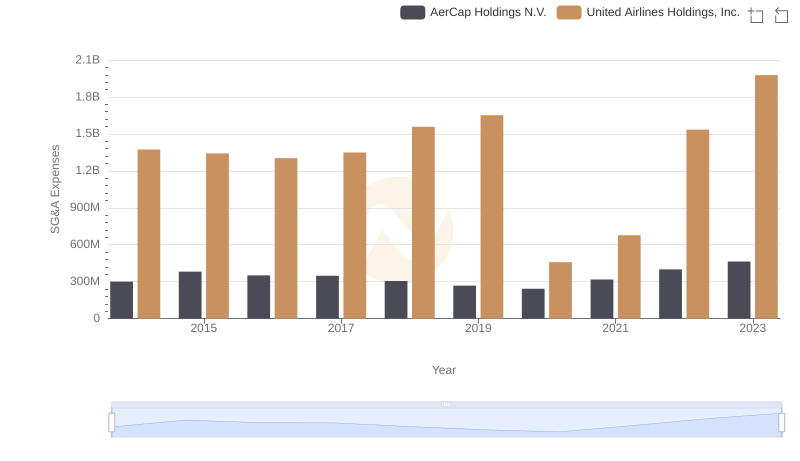
United Airlines Holdings, Inc. or AerCap Holdings N.V.: Who Manages SG&A Costs Better?
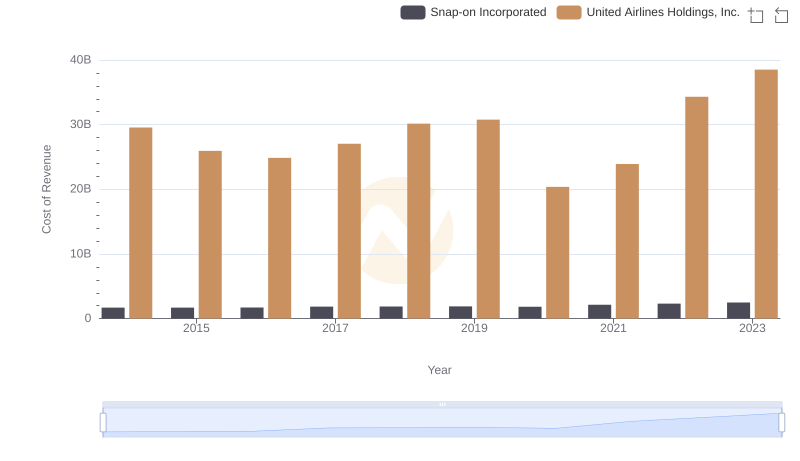
United Airlines Holdings, Inc. vs Snap-on Incorporated: Efficiency in Cost of Revenue Explored
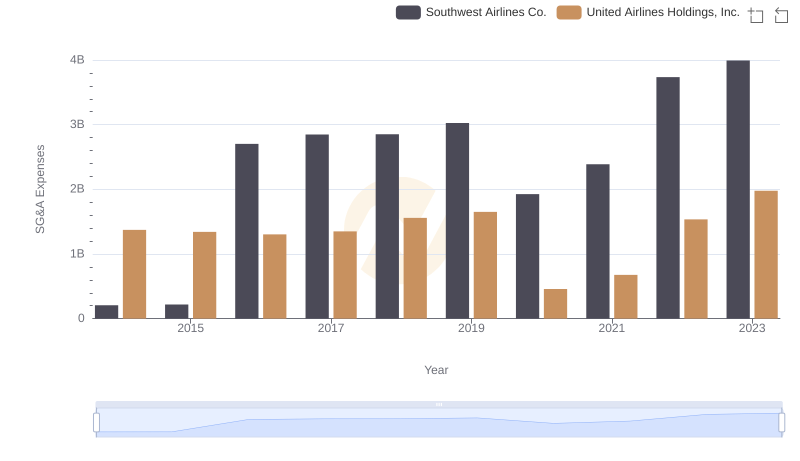
SG&A Efficiency Analysis: Comparing United Airlines Holdings, Inc. and Southwest Airlines Co.
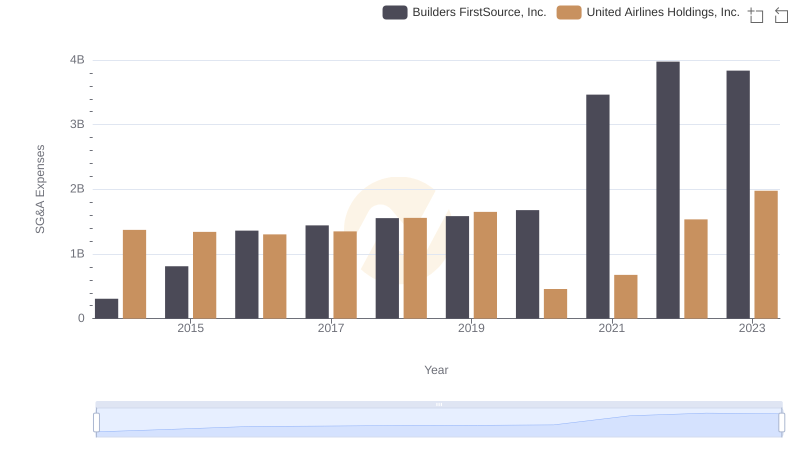
United Airlines Holdings, Inc. and Builders FirstSource, Inc.: SG&A Spending Patterns Compared
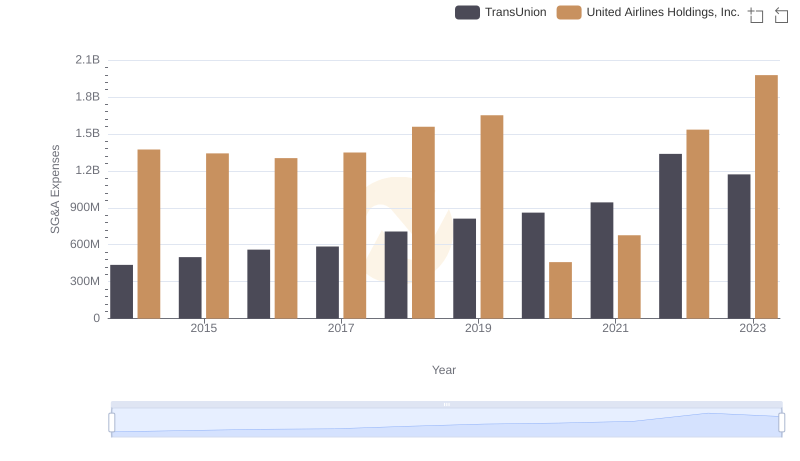
United Airlines Holdings, Inc. vs TransUnion: SG&A Expense Trends
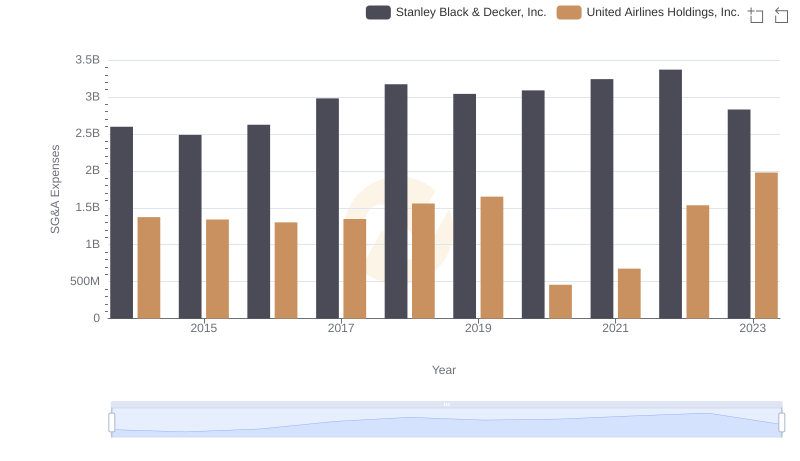
Cost Management Insights: SG&A Expenses for United Airlines Holdings, Inc. and Stanley Black & Decker, Inc.
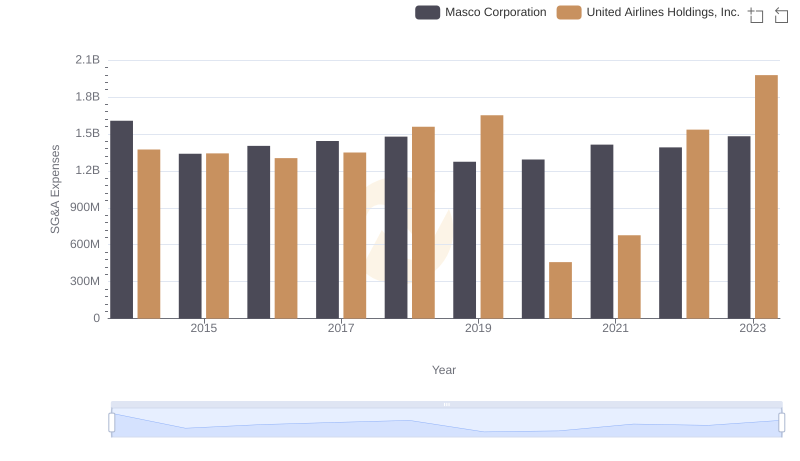
United Airlines Holdings, Inc. or Masco Corporation: Who Manages SG&A Costs Better?
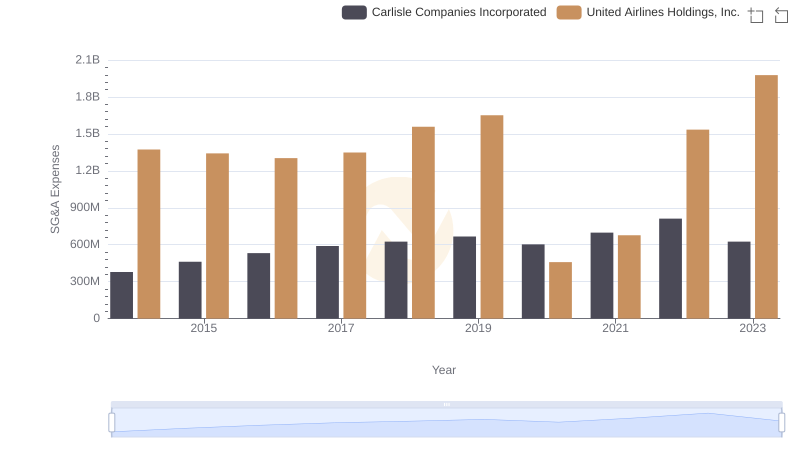
Selling, General, and Administrative Costs: United Airlines Holdings, Inc. vs Carlisle Companies Incorporated
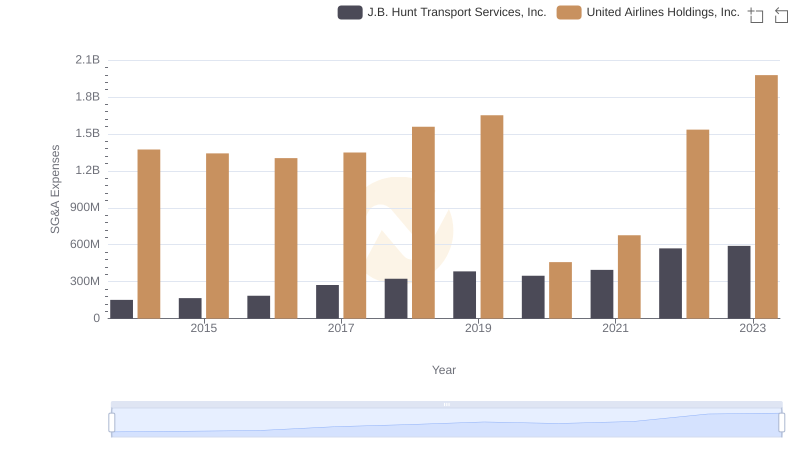
Who Optimizes SG&A Costs Better? United Airlines Holdings, Inc. or J.B. Hunt Transport Services, Inc.