| __timestamp | AerCap Holdings N.V. | United Airlines Holdings, Inc. |
|---|---|---|
| Wednesday, January 1, 2014 | 299900000 | 1373000000 |
| Thursday, January 1, 2015 | 381308000 | 1342000000 |
| Friday, January 1, 2016 | 351012000 | 1303000000 |
| Sunday, January 1, 2017 | 348291000 | 1349000000 |
| Monday, January 1, 2018 | 305226000 | 1558000000 |
| Tuesday, January 1, 2019 | 267458000 | 1651000000 |
| Wednesday, January 1, 2020 | 242161000 | 459000000 |
| Friday, January 1, 2021 | 317888000 | 677000000 |
| Saturday, January 1, 2022 | 399530000 | 1535000000 |
| Sunday, January 1, 2023 | 464128000 | 1977000000 |
| Monday, January 1, 2024 | 2231000000 |
Infusing magic into the data realm
In the competitive world of aviation and leasing, managing Selling, General, and Administrative (SG&A) expenses is crucial for profitability. Over the past decade, AerCap Holdings N.V. and United Airlines Holdings, Inc. have showcased contrasting strategies in this domain. From 2014 to 2023, AerCap's SG&A expenses have remained relatively stable, averaging around 340 million annually, with a notable increase of 55% from 2014 to 2023. In contrast, United Airlines has seen a more volatile trend, with expenses peaking at nearly 2 billion in 2023, marking a 44% increase from 2014. The pandemic year of 2020 saw a significant dip for United, with expenses dropping to 459 million, highlighting the industry's vulnerability to global events. As the aviation sector evolves, these insights into cost management strategies offer valuable lessons for stakeholders aiming to optimize operational efficiency.
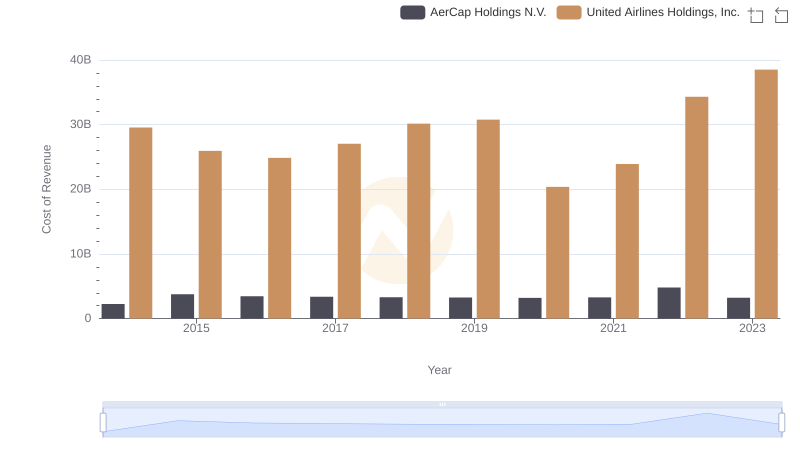
Analyzing Cost of Revenue: United Airlines Holdings, Inc. and AerCap Holdings N.V.
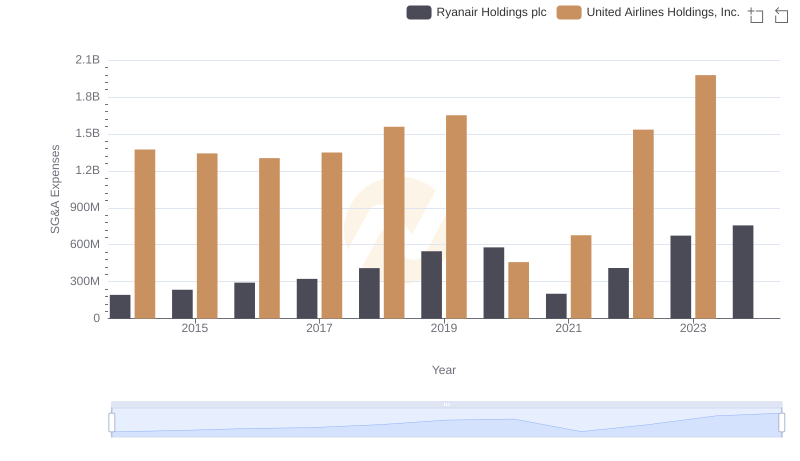
Comparing SG&A Expenses: United Airlines Holdings, Inc. vs Ryanair Holdings plc Trends and Insights
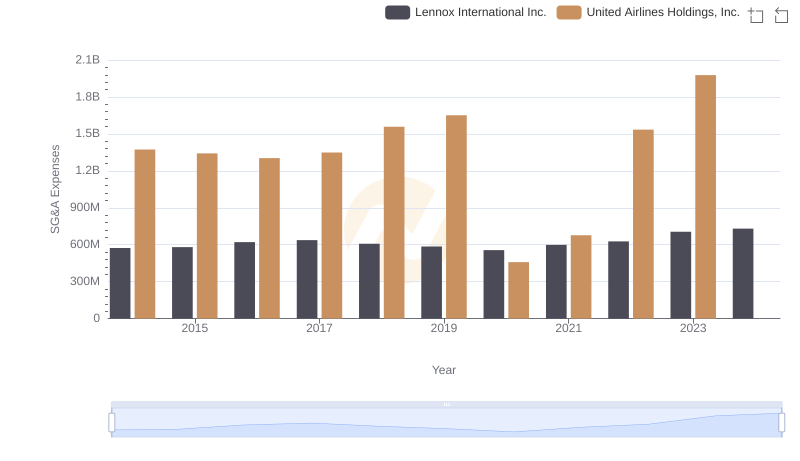
Operational Costs Compared: SG&A Analysis of United Airlines Holdings, Inc. and Lennox International Inc.
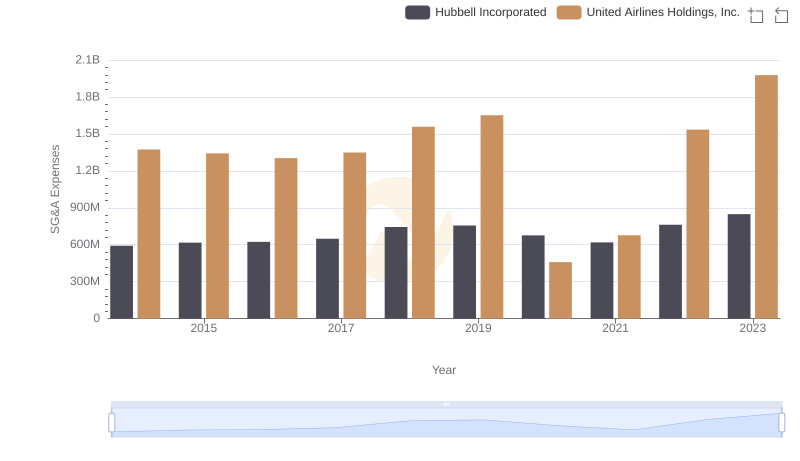
United Airlines Holdings, Inc. and Hubbell Incorporated: SG&A Spending Patterns Compared
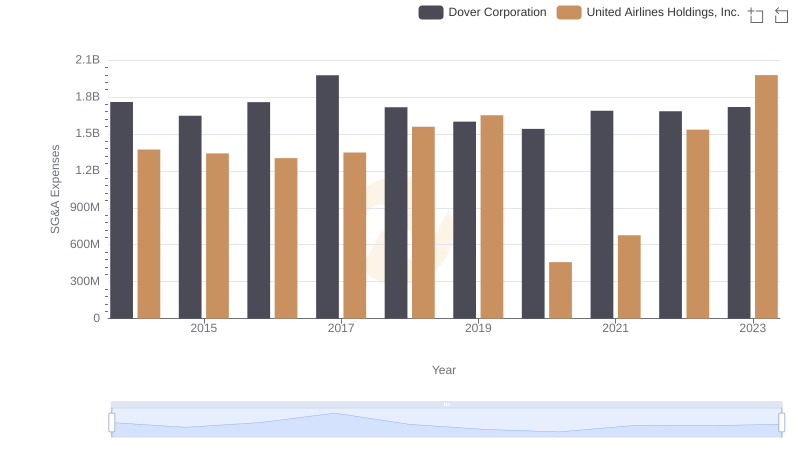
SG&A Efficiency Analysis: Comparing United Airlines Holdings, Inc. and Dover Corporation
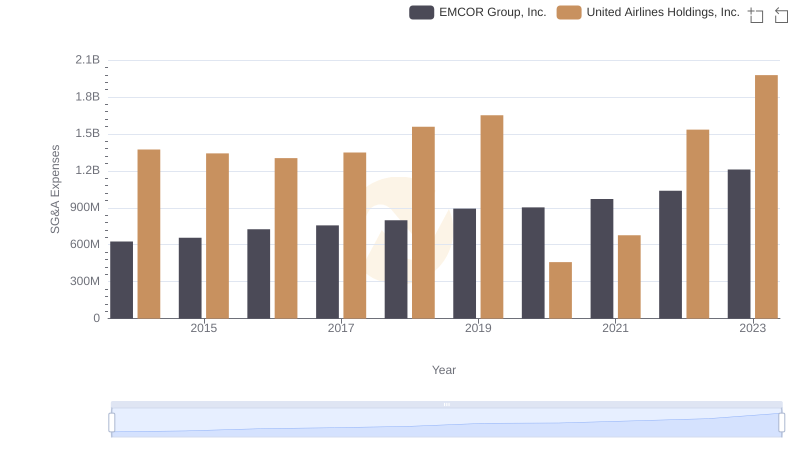
Cost Management Insights: SG&A Expenses for United Airlines Holdings, Inc. and EMCOR Group, Inc.
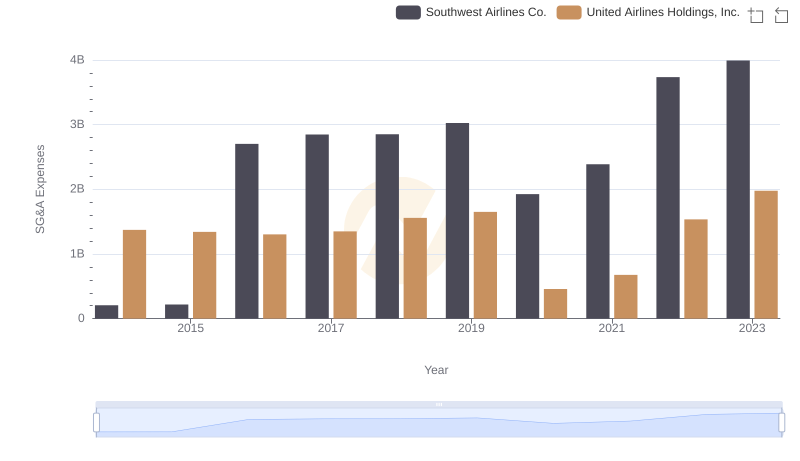
SG&A Efficiency Analysis: Comparing United Airlines Holdings, Inc. and Southwest Airlines Co.
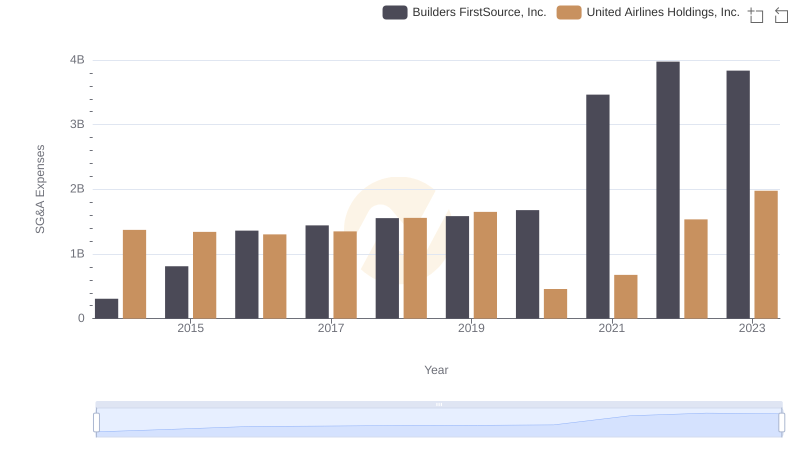
United Airlines Holdings, Inc. and Builders FirstSource, Inc.: SG&A Spending Patterns Compared
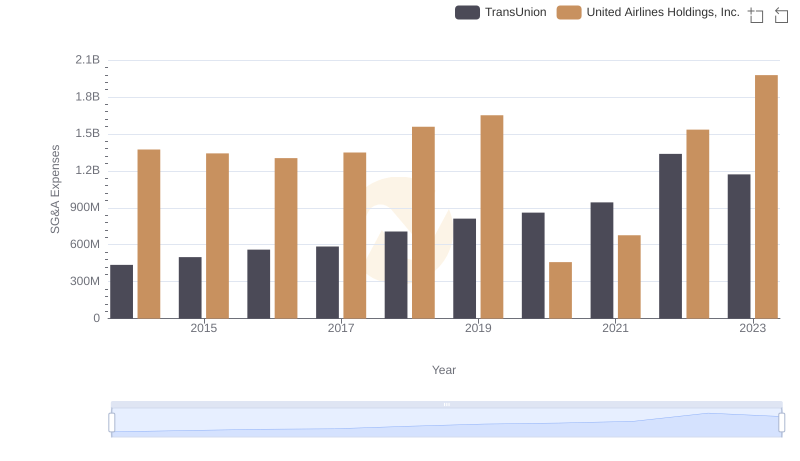
United Airlines Holdings, Inc. vs TransUnion: SG&A Expense Trends
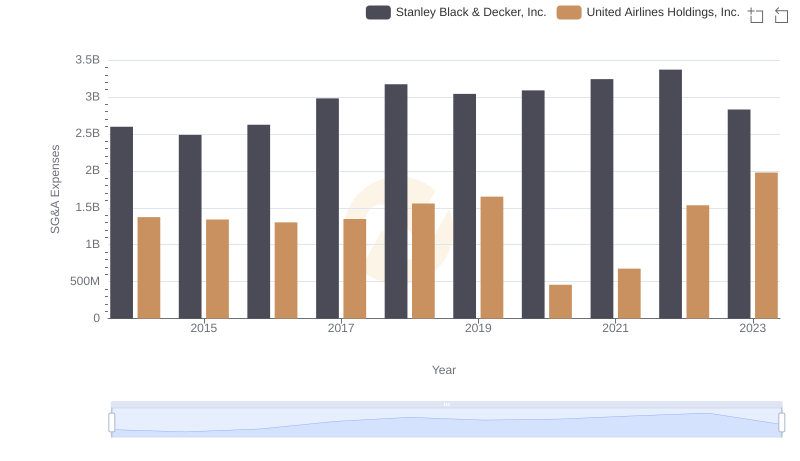
Cost Management Insights: SG&A Expenses for United Airlines Holdings, Inc. and Stanley Black & Decker, Inc.