| __timestamp | Southwest Airlines Co. | United Airlines Holdings, Inc. |
|---|---|---|
| Wednesday, January 1, 2014 | 207000000 | 1373000000 |
| Thursday, January 1, 2015 | 218000000 | 1342000000 |
| Friday, January 1, 2016 | 2703000000 | 1303000000 |
| Sunday, January 1, 2017 | 2847000000 | 1349000000 |
| Monday, January 1, 2018 | 2852000000 | 1558000000 |
| Tuesday, January 1, 2019 | 3026000000 | 1651000000 |
| Wednesday, January 1, 2020 | 1926000000 | 459000000 |
| Friday, January 1, 2021 | 2388000000 | 677000000 |
| Saturday, January 1, 2022 | 3735000000 | 1535000000 |
| Sunday, January 1, 2023 | 3992000000 | 1977000000 |
| Monday, January 1, 2024 | 0 | 2231000000 |
Unlocking the unknown
In the competitive skies of the airline industry, managing costs is crucial for profitability. This analysis compares the Selling, General, and Administrative (SG&A) expenses of United Airlines Holdings, Inc. and Southwest Airlines Co. from 2014 to 2023. Over this period, Southwest Airlines consistently outpaced United Airlines in SG&A efficiency. Notably, in 2023, Southwest's SG&A expenses were nearly double those of United, highlighting a strategic focus on cost management.
From 2014 to 2019, Southwest's SG&A expenses grew by approximately 46%, while United's increased by about 20%. The pandemic year of 2020 saw a dip in expenses for both airlines, with United's expenses dropping to 35% of its 2019 levels. However, by 2023, both airlines had rebounded, with Southwest's expenses reaching their highest point in the decade. This data underscores the dynamic nature of airline financial strategies and the importance of efficient cost management.
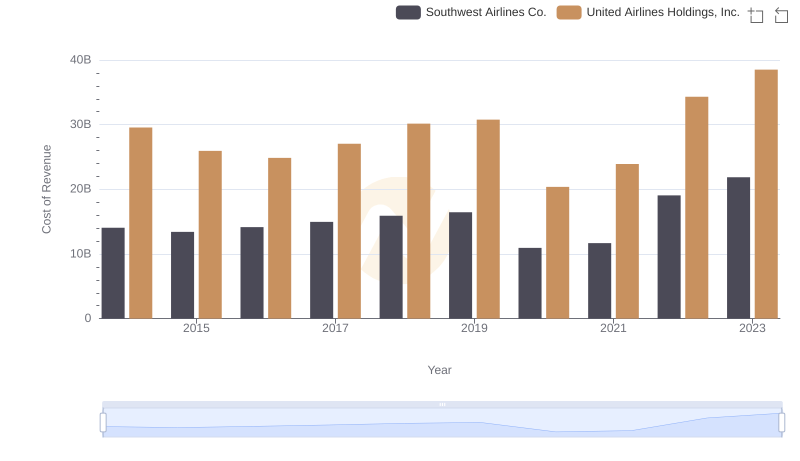
Cost of Revenue Trends: United Airlines Holdings, Inc. vs Southwest Airlines Co.
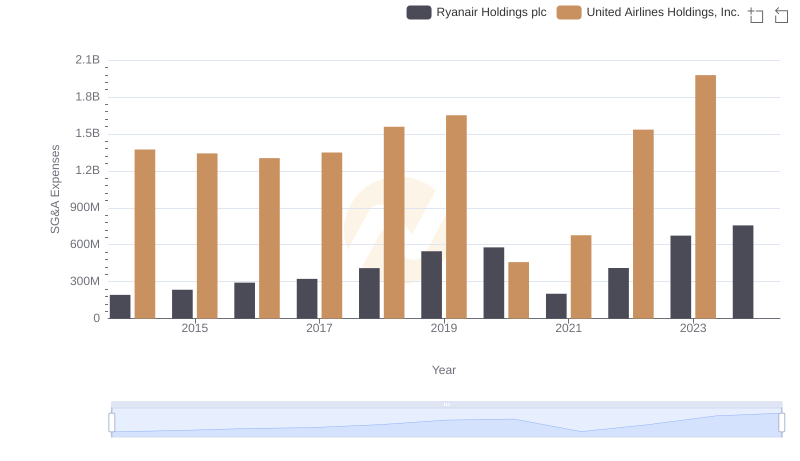
Comparing SG&A Expenses: United Airlines Holdings, Inc. vs Ryanair Holdings plc Trends and Insights
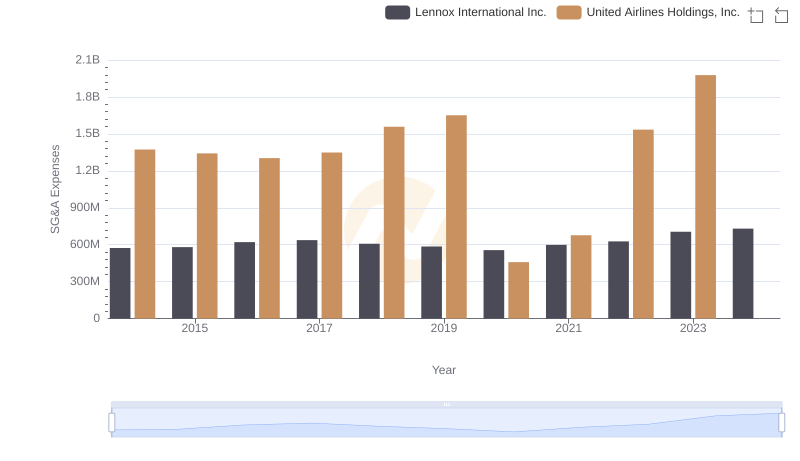
Operational Costs Compared: SG&A Analysis of United Airlines Holdings, Inc. and Lennox International Inc.
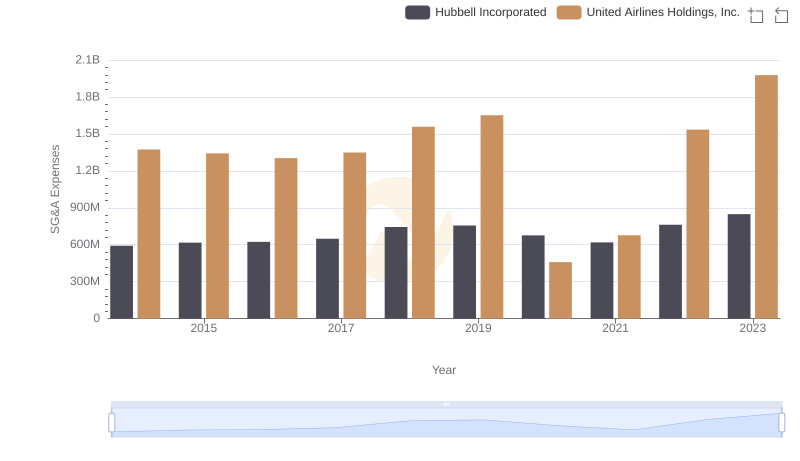
United Airlines Holdings, Inc. and Hubbell Incorporated: SG&A Spending Patterns Compared
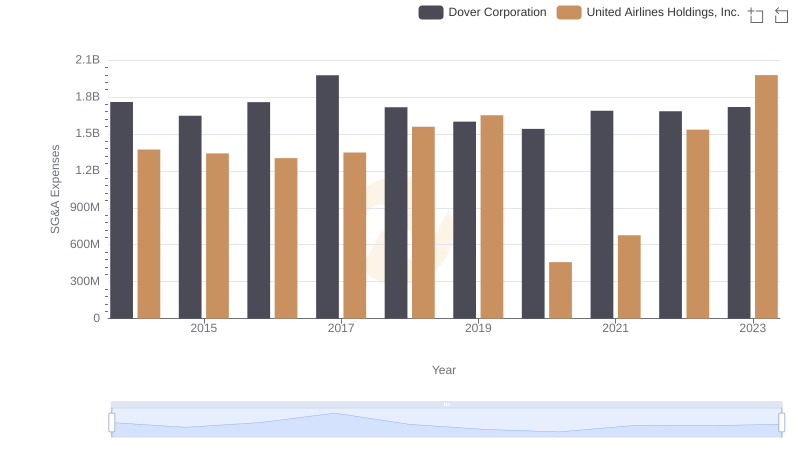
SG&A Efficiency Analysis: Comparing United Airlines Holdings, Inc. and Dover Corporation
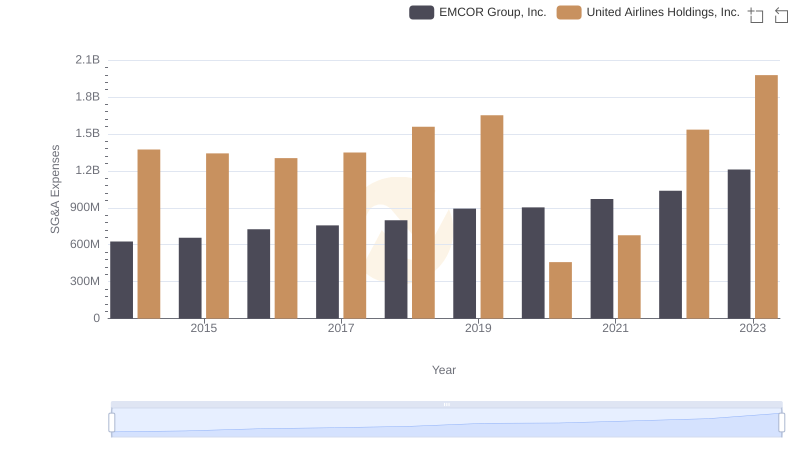
Cost Management Insights: SG&A Expenses for United Airlines Holdings, Inc. and EMCOR Group, Inc.
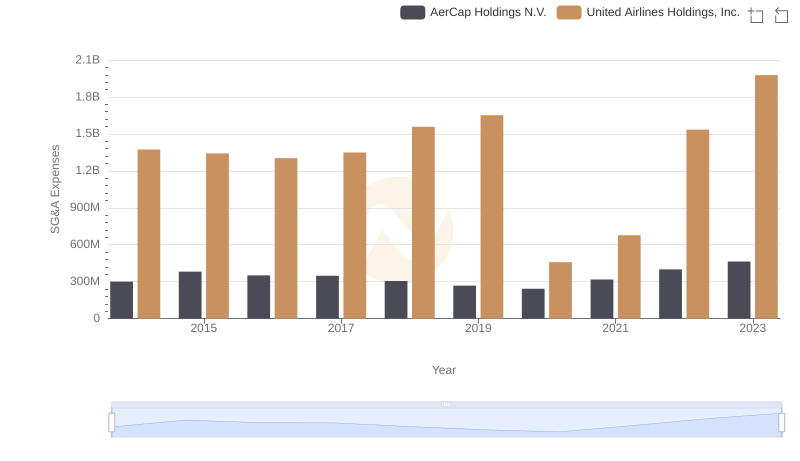
United Airlines Holdings, Inc. or AerCap Holdings N.V.: Who Manages SG&A Costs Better?
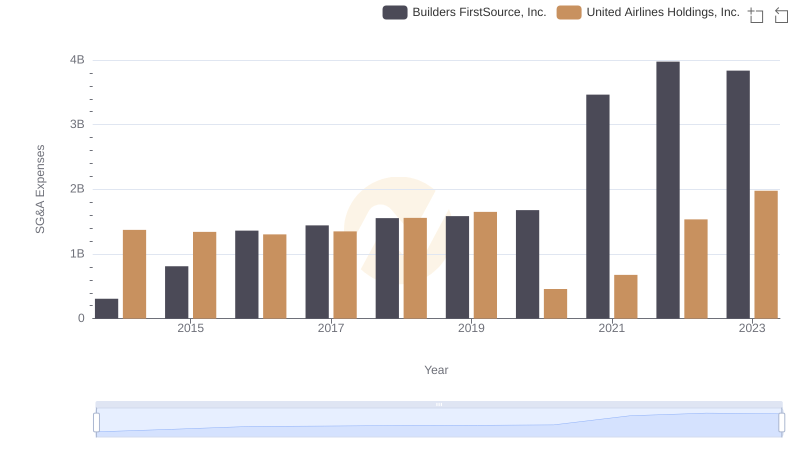
United Airlines Holdings, Inc. and Builders FirstSource, Inc.: SG&A Spending Patterns Compared
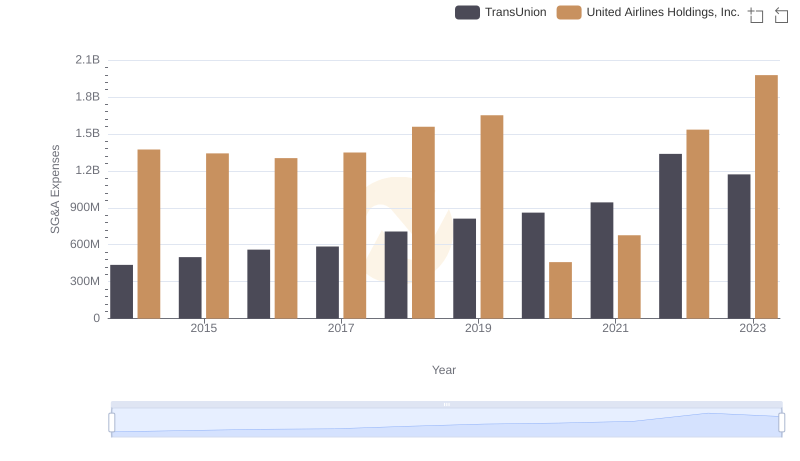
United Airlines Holdings, Inc. vs TransUnion: SG&A Expense Trends
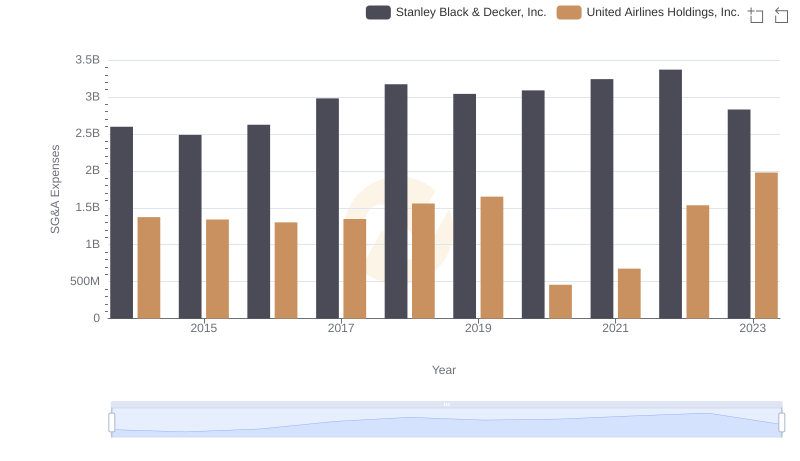
Cost Management Insights: SG&A Expenses for United Airlines Holdings, Inc. and Stanley Black & Decker, Inc.