| __timestamp | Carlisle Companies Incorporated | United Airlines Holdings, Inc. |
|---|---|---|
| Wednesday, January 1, 2014 | 379000000 | 1373000000 |
| Thursday, January 1, 2015 | 461900000 | 1342000000 |
| Friday, January 1, 2016 | 532000000 | 1303000000 |
| Sunday, January 1, 2017 | 589400000 | 1349000000 |
| Monday, January 1, 2018 | 625400000 | 1558000000 |
| Tuesday, January 1, 2019 | 667100000 | 1651000000 |
| Wednesday, January 1, 2020 | 603200000 | 459000000 |
| Friday, January 1, 2021 | 698200000 | 677000000 |
| Saturday, January 1, 2022 | 811500000 | 1535000000 |
| Sunday, January 1, 2023 | 625200000 | 1977000000 |
| Monday, January 1, 2024 | 722800000 | 2231000000 |
Infusing magic into the data realm
In the ever-evolving landscape of corporate America, understanding the financial health of companies is crucial. Selling, General, and Administrative (SG&A) expenses are a key indicator of operational efficiency. This analysis compares United Airlines Holdings, Inc. and Carlisle Companies Incorporated from 2014 to 2023.
United Airlines, a titan in the aviation industry, consistently reported higher SG&A expenses, peaking in 2023 with a 44% increase from 2020. This surge reflects the airline's strategic investments post-pandemic. Meanwhile, Carlisle Companies, a diversified manufacturer, saw a steady rise in SG&A costs, with a notable 114% increase from 2014 to 2022, before a slight dip in 2023.
This comparison highlights the contrasting financial strategies of a service-oriented airline and a manufacturing giant, offering insights into their operational priorities and market adaptations over the past decade.
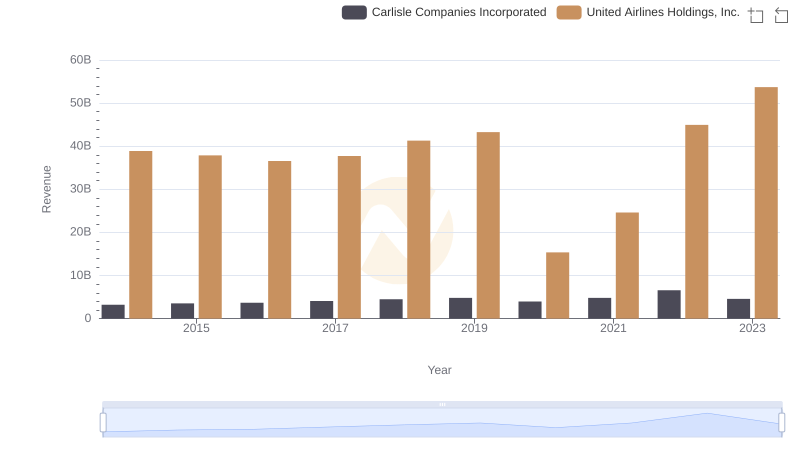
United Airlines Holdings, Inc. or Carlisle Companies Incorporated: Who Leads in Yearly Revenue?
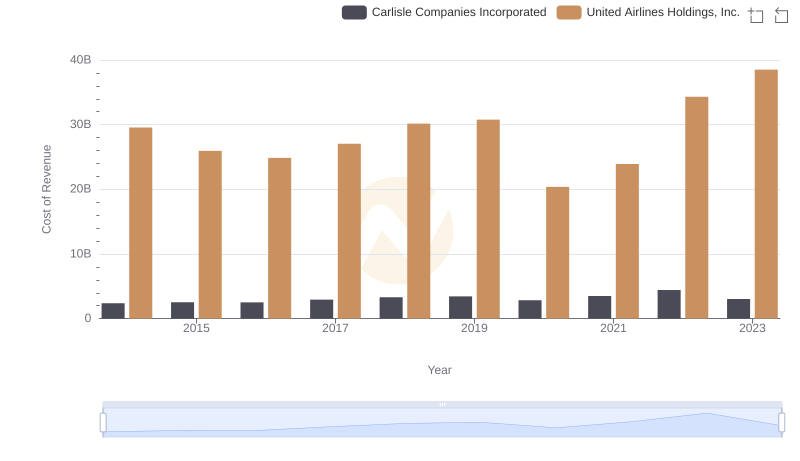
Analyzing Cost of Revenue: United Airlines Holdings, Inc. and Carlisle Companies Incorporated
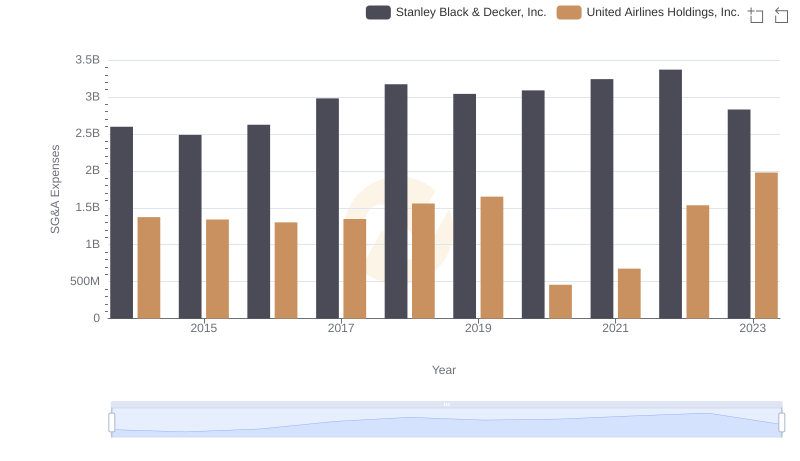
Cost Management Insights: SG&A Expenses for United Airlines Holdings, Inc. and Stanley Black & Decker, Inc.
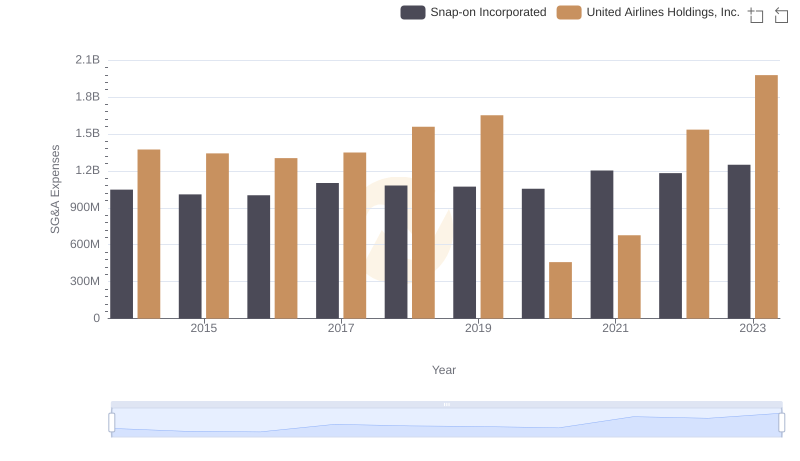
Breaking Down SG&A Expenses: United Airlines Holdings, Inc. vs Snap-on Incorporated
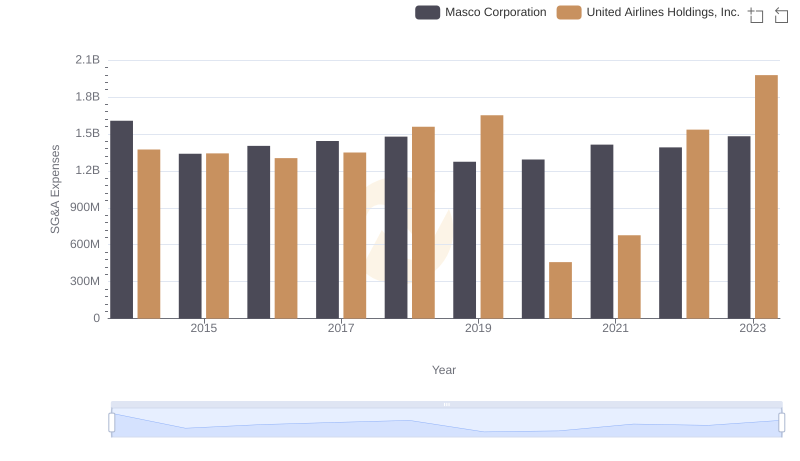
United Airlines Holdings, Inc. or Masco Corporation: Who Manages SG&A Costs Better?
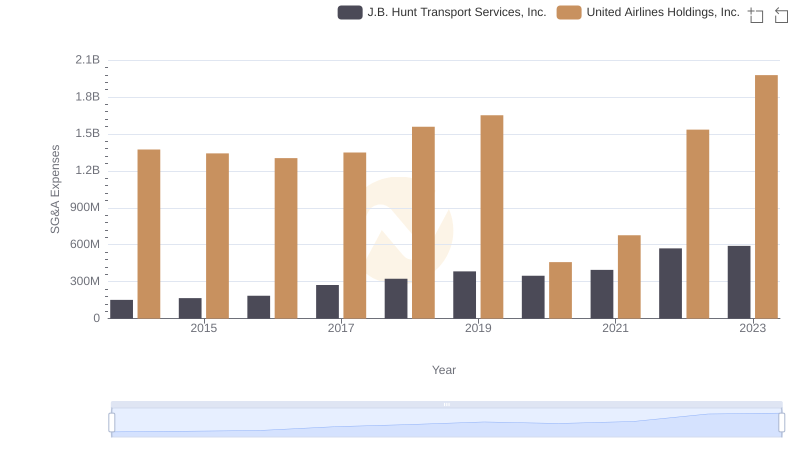
Who Optimizes SG&A Costs Better? United Airlines Holdings, Inc. or J.B. Hunt Transport Services, Inc.
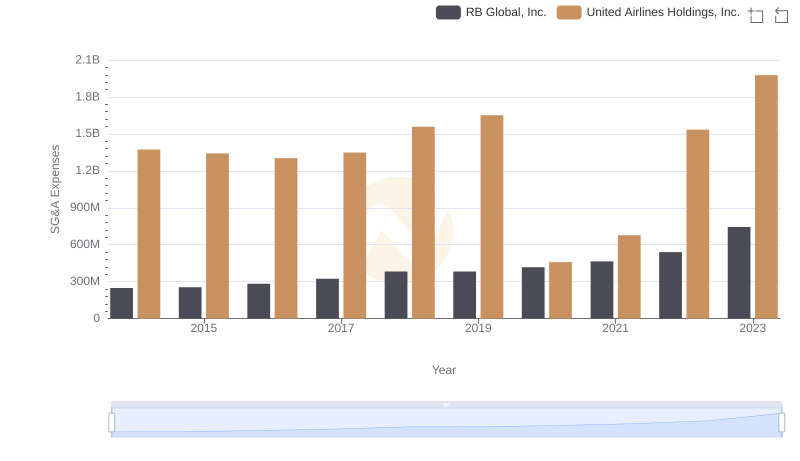
United Airlines Holdings, Inc. vs RB Global, Inc.: SG&A Expense Trends
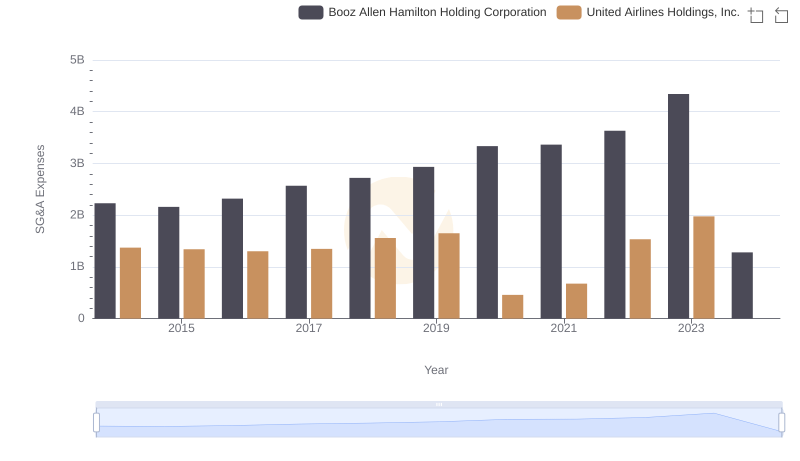
United Airlines Holdings, Inc. or Booz Allen Hamilton Holding Corporation: Who Manages SG&A Costs Better?