| __timestamp | TransUnion | United Airlines Holdings, Inc. |
|---|---|---|
| Wednesday, January 1, 2014 | 436000000 | 1373000000 |
| Thursday, January 1, 2015 | 499700000 | 1342000000 |
| Friday, January 1, 2016 | 560100000 | 1303000000 |
| Sunday, January 1, 2017 | 585400000 | 1349000000 |
| Monday, January 1, 2018 | 707700000 | 1558000000 |
| Tuesday, January 1, 2019 | 812100000 | 1651000000 |
| Wednesday, January 1, 2020 | 860300000 | 459000000 |
| Friday, January 1, 2021 | 943900000 | 677000000 |
| Saturday, January 1, 2022 | 1337400000 | 1535000000 |
| Sunday, January 1, 2023 | 1171600000 | 1977000000 |
| Monday, January 1, 2024 | 1239300000 | 2231000000 |
Igniting the spark of knowledge
In the ever-evolving landscape of corporate finance, understanding the trends in Selling, General, and Administrative (SG&A) expenses is crucial. Over the past decade, United Airlines Holdings, Inc. and TransUnion have shown distinct trajectories in their SG&A expenditures. From 2014 to 2023, United Airlines experienced a 44% increase in SG&A expenses, peaking in 2023. This surge reflects strategic investments and operational adjustments, especially post-2020, when expenses dipped significantly due to the pandemic.
Conversely, TransUnion's SG&A expenses grew by approximately 169% over the same period, with a notable spike in 2022. This growth underscores TransUnion's expansion and increased market activities. The contrasting trends between these two giants highlight the diverse strategies companies employ to navigate economic challenges and opportunities. As we move forward, monitoring these expenses will provide insights into their strategic priorities and market positioning.
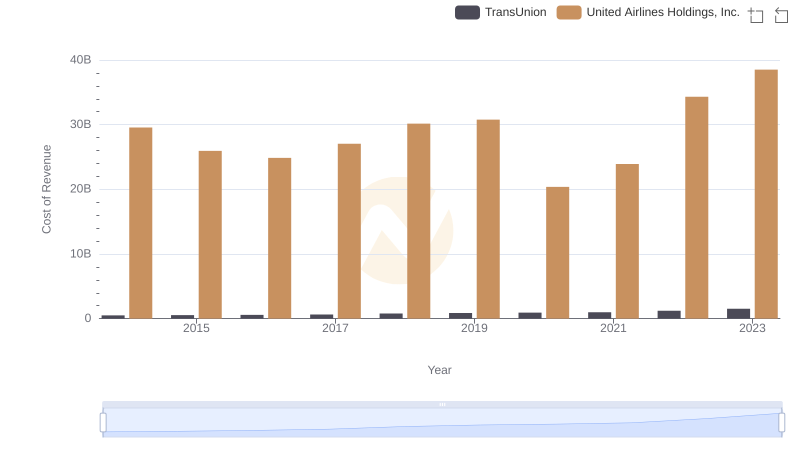
United Airlines Holdings, Inc. vs TransUnion: Efficiency in Cost of Revenue Explored
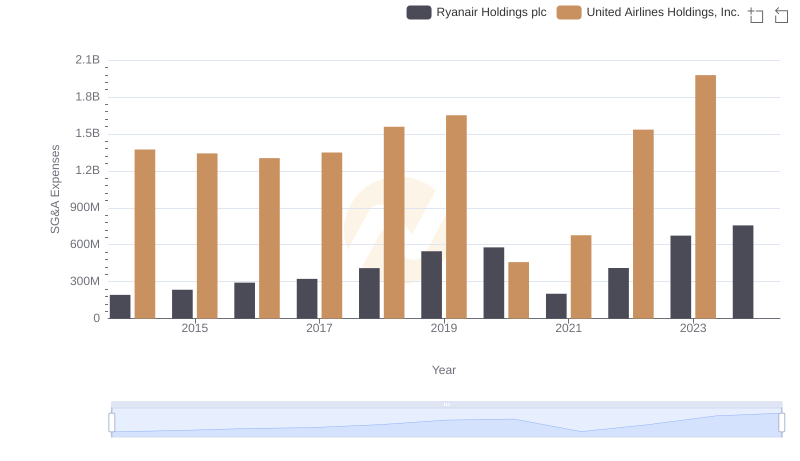
Comparing SG&A Expenses: United Airlines Holdings, Inc. vs Ryanair Holdings plc Trends and Insights
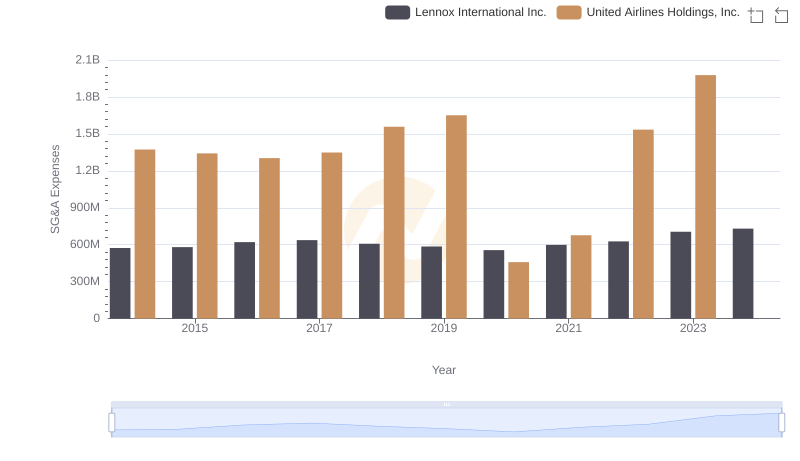
Operational Costs Compared: SG&A Analysis of United Airlines Holdings, Inc. and Lennox International Inc.
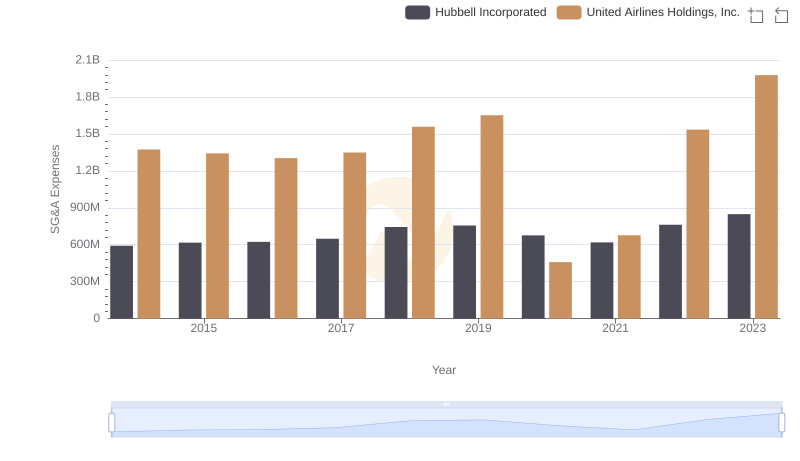
United Airlines Holdings, Inc. and Hubbell Incorporated: SG&A Spending Patterns Compared
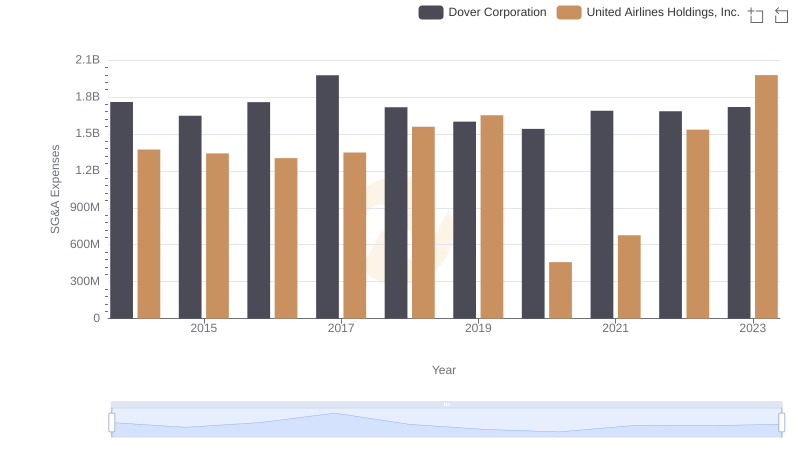
SG&A Efficiency Analysis: Comparing United Airlines Holdings, Inc. and Dover Corporation
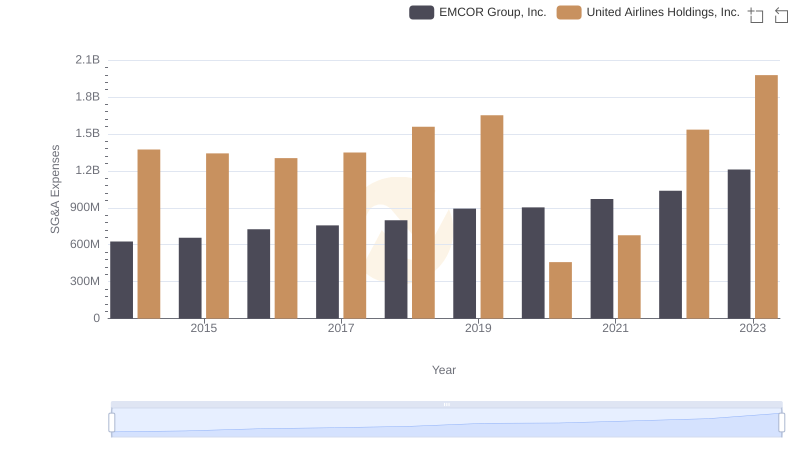
Cost Management Insights: SG&A Expenses for United Airlines Holdings, Inc. and EMCOR Group, Inc.
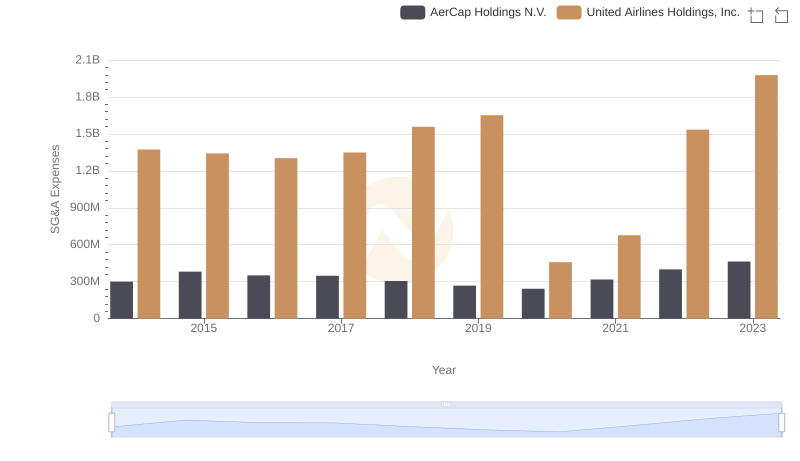
United Airlines Holdings, Inc. or AerCap Holdings N.V.: Who Manages SG&A Costs Better?
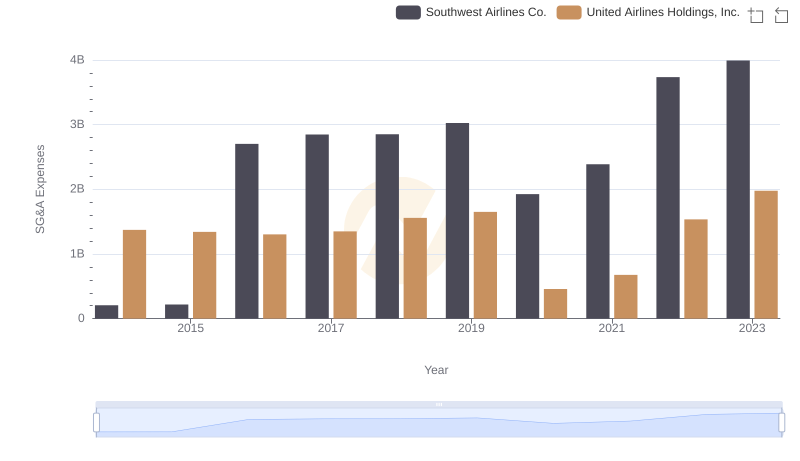
SG&A Efficiency Analysis: Comparing United Airlines Holdings, Inc. and Southwest Airlines Co.
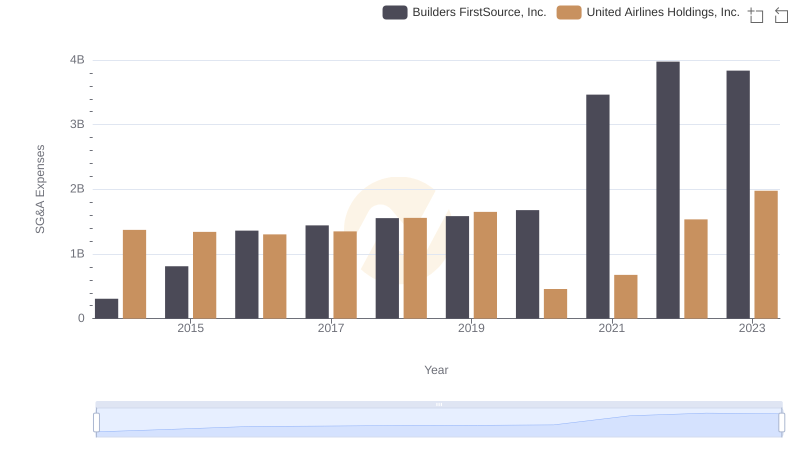
United Airlines Holdings, Inc. and Builders FirstSource, Inc.: SG&A Spending Patterns Compared
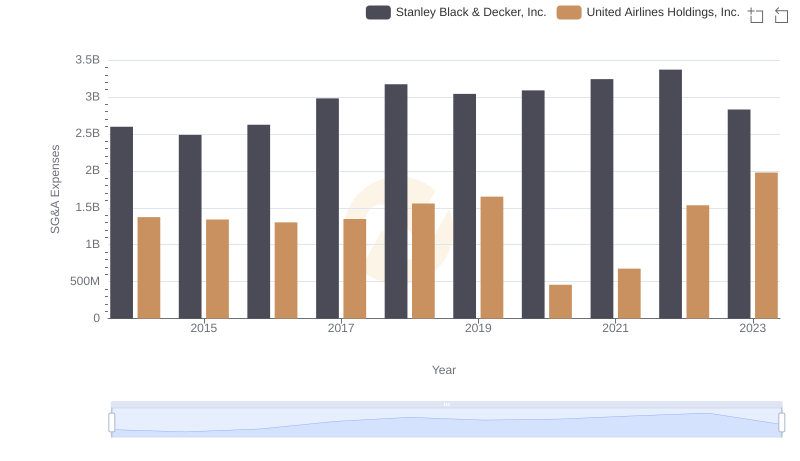
Cost Management Insights: SG&A Expenses for United Airlines Holdings, Inc. and Stanley Black & Decker, Inc.