| __timestamp | Builders FirstSource, Inc. | United Airlines Holdings, Inc. |
|---|---|---|
| Wednesday, January 1, 2014 | 306508000 | 1373000000 |
| Thursday, January 1, 2015 | 810841000 | 1342000000 |
| Friday, January 1, 2016 | 1360412000 | 1303000000 |
| Sunday, January 1, 2017 | 1442288000 | 1349000000 |
| Monday, January 1, 2018 | 1553972000 | 1558000000 |
| Tuesday, January 1, 2019 | 1584523000 | 1651000000 |
| Wednesday, January 1, 2020 | 1678730000 | 459000000 |
| Friday, January 1, 2021 | 3463532000 | 677000000 |
| Saturday, January 1, 2022 | 3974173000 | 1535000000 |
| Sunday, January 1, 2023 | 3836015000 | 1977000000 |
| Monday, January 1, 2024 | 2231000000 |
Unlocking the unknown
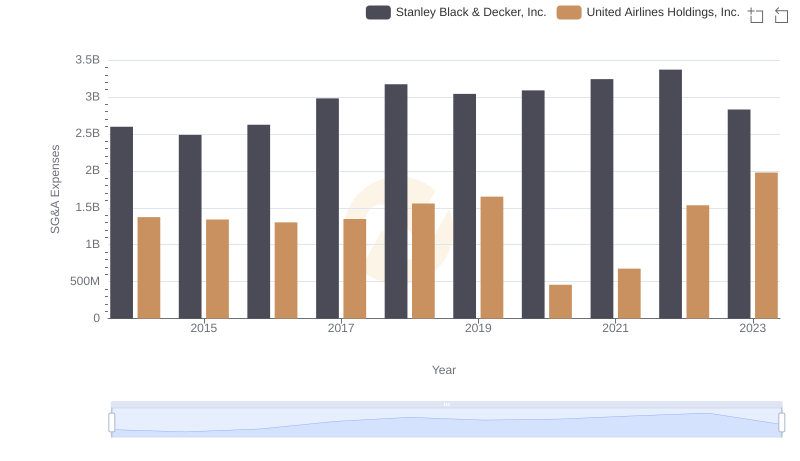
In the ever-evolving landscape of corporate finance, understanding the nuances of Selling, General, and Administrative (SG&A) expenses is crucial. Over the past decade, Builders FirstSource, Inc. and United Airlines Holdings, Inc. have showcased distinct spending patterns. From 2014 to 2023, Builders FirstSource saw a staggering 1,150% increase in SG&A expenses, peaking in 2022. This reflects the company's aggressive expansion and strategic investments in the construction sector. In contrast, United Airlines experienced a more modest 44% rise, with a notable dip in 2020, likely due to the pandemic's impact on the aviation industry. By 2023, United Airlines' SG&A expenses rebounded, indicating a recovery phase. These trends highlight the contrasting financial strategies and market challenges faced by companies in different sectors. As businesses navigate economic uncertainties, analyzing SG&A trends offers valuable insights into their operational priorities and resilience.
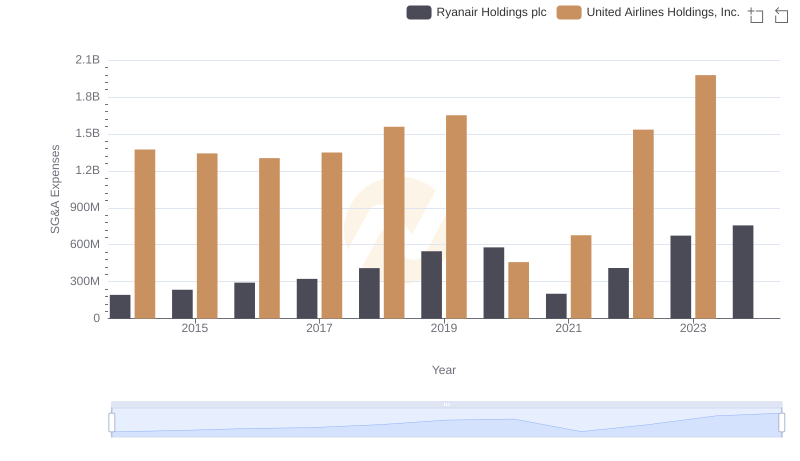
Comparing SG&A Expenses: United Airlines Holdings, Inc. vs Ryanair Holdings plc Trends and Insights
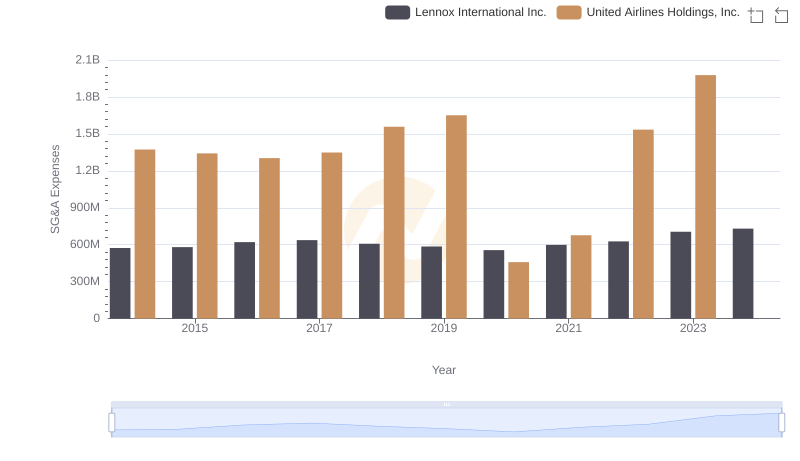
Operational Costs Compared: SG&A Analysis of United Airlines Holdings, Inc. and Lennox International Inc.
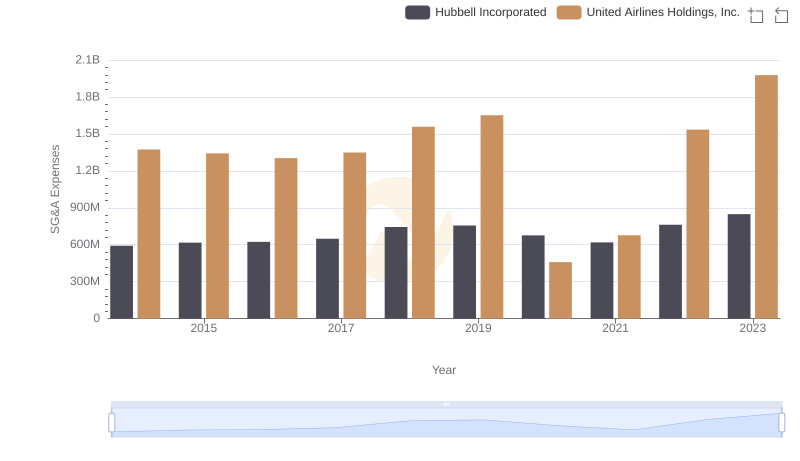
United Airlines Holdings, Inc. and Hubbell Incorporated: SG&A Spending Patterns Compared
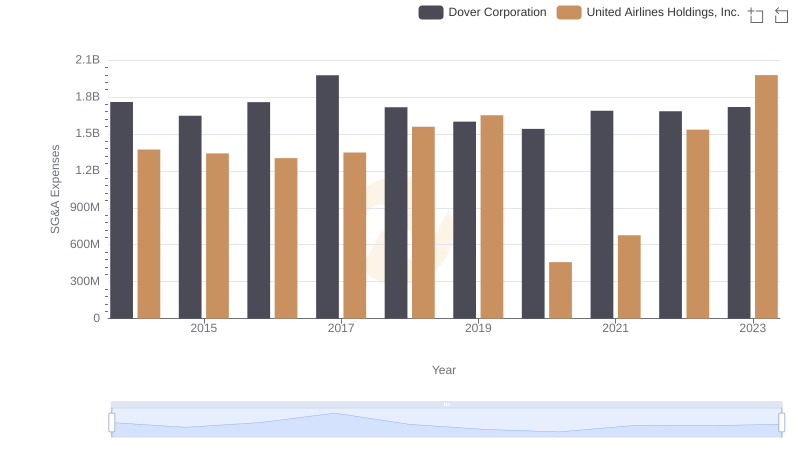
SG&A Efficiency Analysis: Comparing United Airlines Holdings, Inc. and Dover Corporation
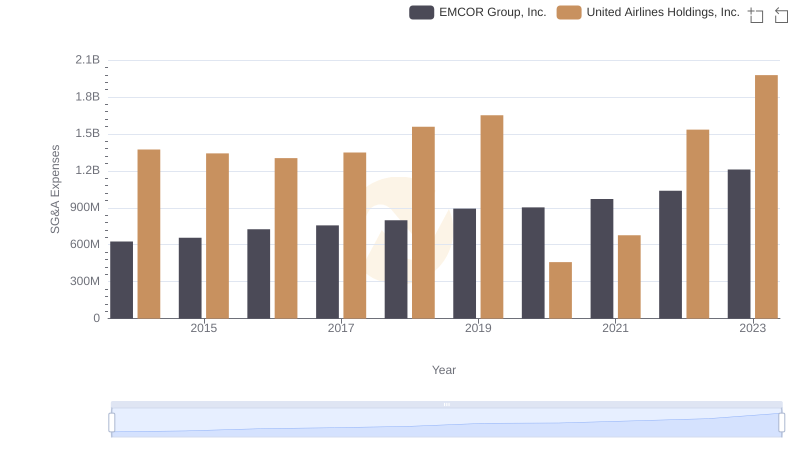
Cost Management Insights: SG&A Expenses for United Airlines Holdings, Inc. and EMCOR Group, Inc.
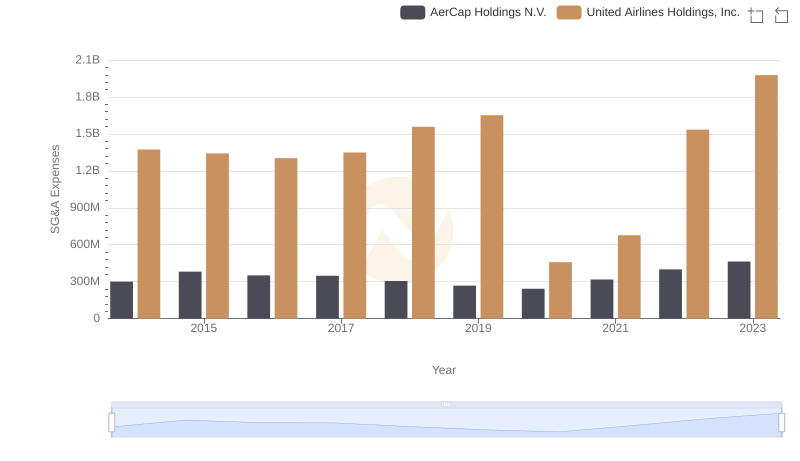
United Airlines Holdings, Inc. or AerCap Holdings N.V.: Who Manages SG&A Costs Better?
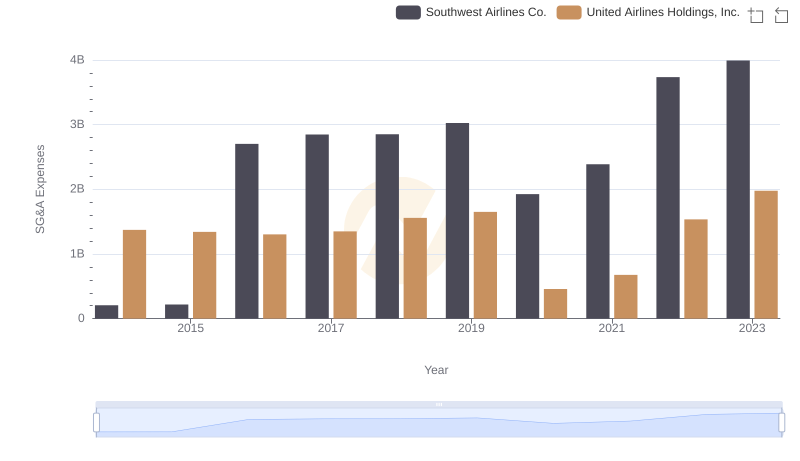
SG&A Efficiency Analysis: Comparing United Airlines Holdings, Inc. and Southwest Airlines Co.
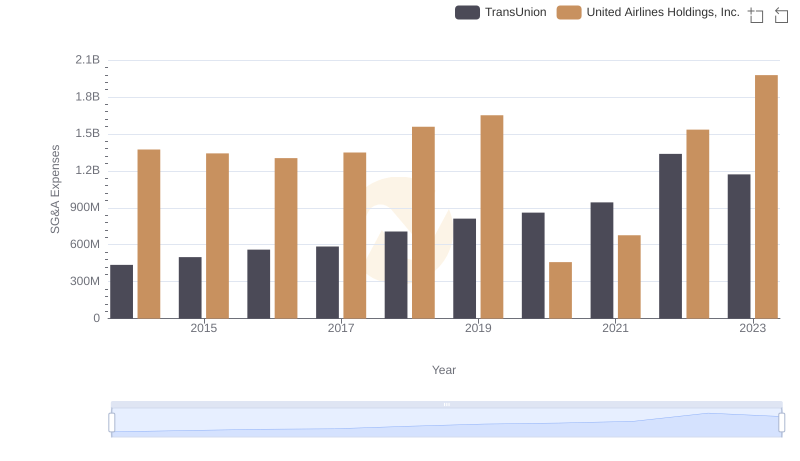
United Airlines Holdings, Inc. vs TransUnion: SG&A Expense Trends
Cost Management Insights: SG&A Expenses for United Airlines Holdings, Inc. and Stanley Black & Decker, Inc.