| __timestamp | International Business Machines Corporation | QUALCOMM Incorporated |
|---|---|---|
| Wednesday, January 1, 2014 | 24962000000 | 9490000000 |
| Thursday, January 1, 2015 | 20268000000 | 8641000000 |
| Friday, January 1, 2016 | 17341000000 | 8240000000 |
| Sunday, January 1, 2017 | 16556000000 | 6043000000 |
| Monday, January 1, 2018 | 16545000000 | 5335000000 |
| Tuesday, January 1, 2019 | 14609000000 | 9482000000 |
| Wednesday, January 1, 2020 | 10555000000 | 7620000000 |
| Friday, January 1, 2021 | 12409000000 | 11371000000 |
| Saturday, January 1, 2022 | 7174000000 | 16563000000 |
| Sunday, January 1, 2023 | 14693000000 | 10459000000 |
| Monday, January 1, 2024 | 6015000000 | 12739000000 |
Unleashing insights
In the ever-evolving landscape of technology giants, International Business Machines Corporation (IBM) and QUALCOMM Incorporated have been pivotal players. Over the past decade, from 2014 to 2024, these companies have showcased contrasting trajectories in their EBITDA performance. IBM, once a leader with an EBITDA of approximately $24.6 billion in 2014, saw a decline of nearly 75% by 2024. In contrast, QUALCOMM's EBITDA grew by about 34% during the same period, peaking at around $16.6 billion in 2022. This divergence highlights the shifting dynamics in the tech industry, where innovation and adaptability are key. As IBM focuses on restructuring and strategic pivots, QUALCOMM's growth underscores its stronghold in the semiconductor market. This data not only reflects past performance but also sets the stage for future strategic decisions in the tech sector.
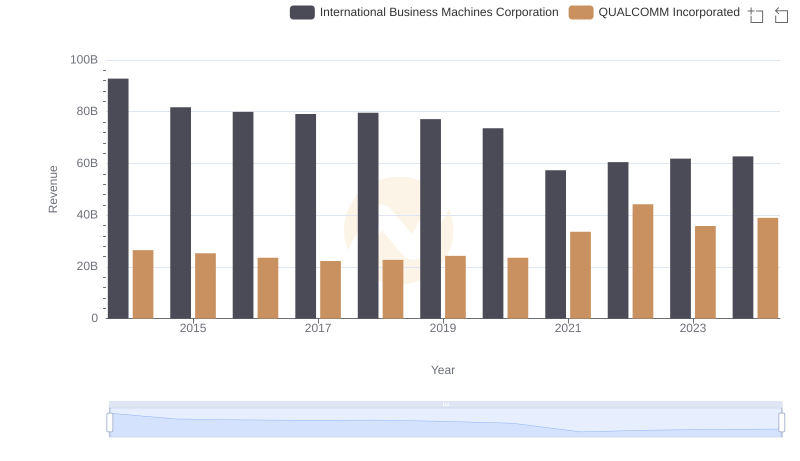
Comparing Revenue Performance: International Business Machines Corporation or QUALCOMM Incorporated?
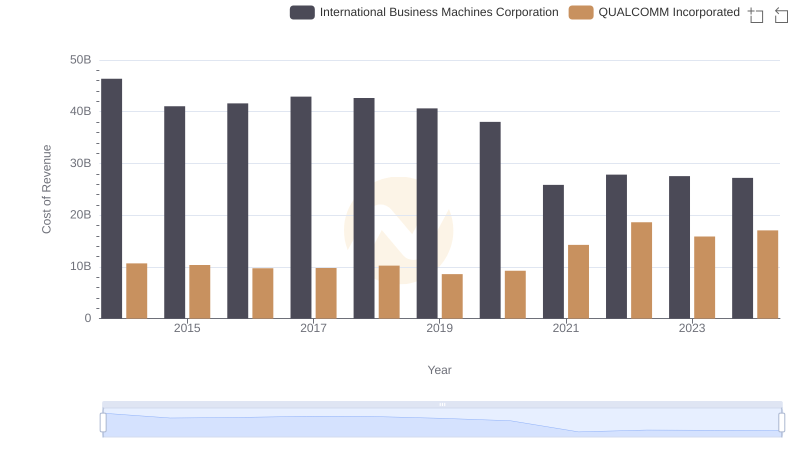
Cost of Revenue Comparison: International Business Machines Corporation vs QUALCOMM Incorporated
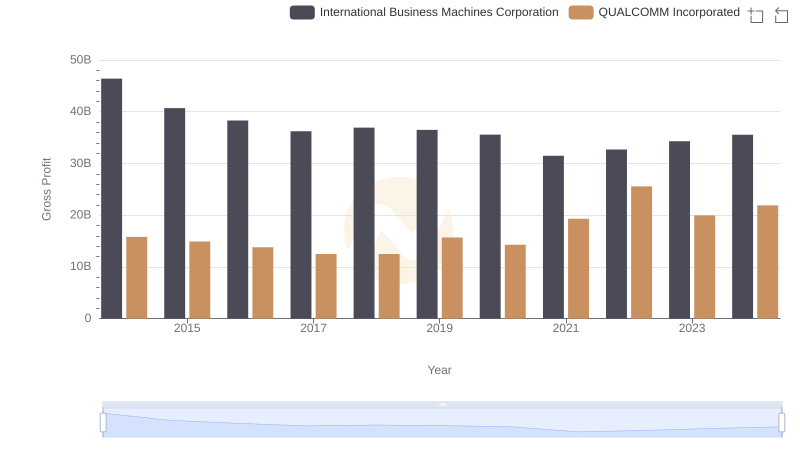
Gross Profit Trends Compared: International Business Machines Corporation vs QUALCOMM Incorporated
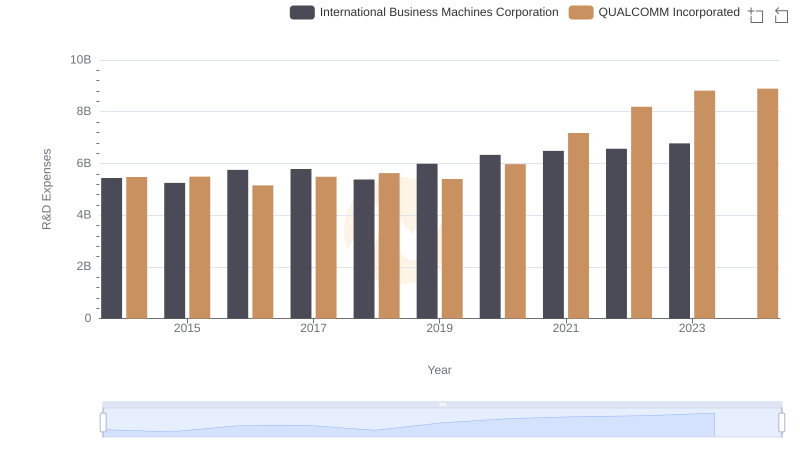
International Business Machines Corporation vs QUALCOMM Incorporated: Strategic Focus on R&D Spending
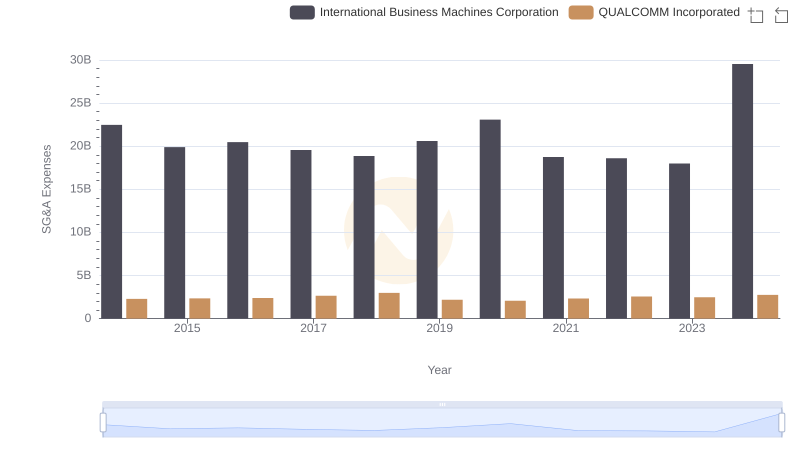
Breaking Down SG&A Expenses: International Business Machines Corporation vs QUALCOMM Incorporated
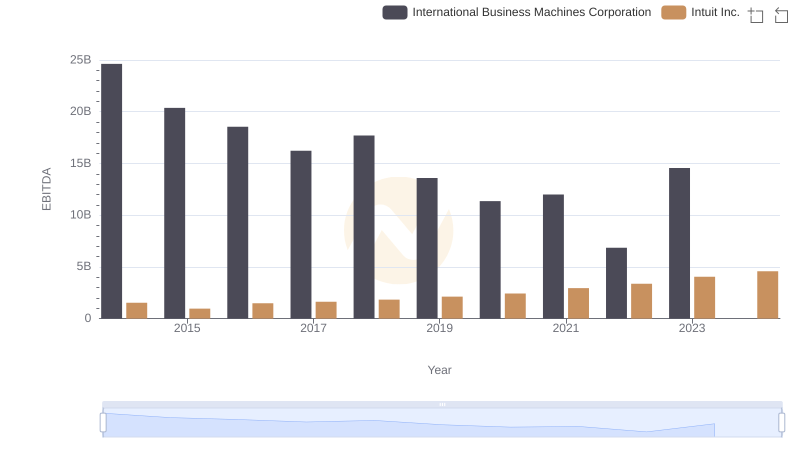
International Business Machines Corporation vs Intuit Inc.: In-Depth EBITDA Performance Comparison
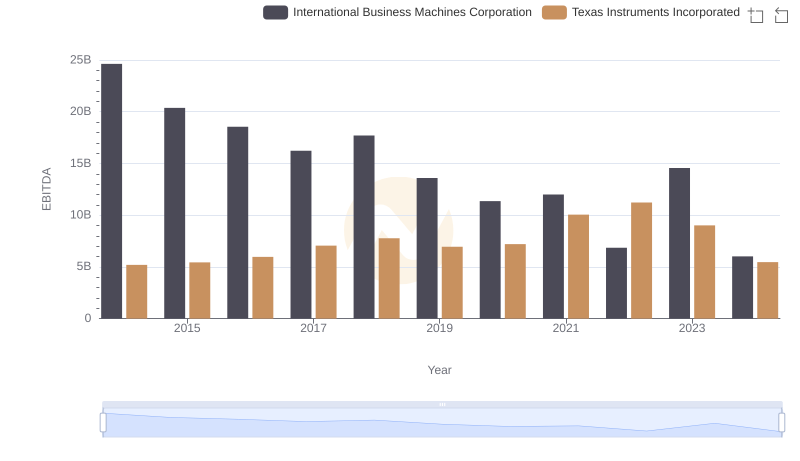
EBITDA Performance Review: International Business Machines Corporation vs Texas Instruments Incorporated
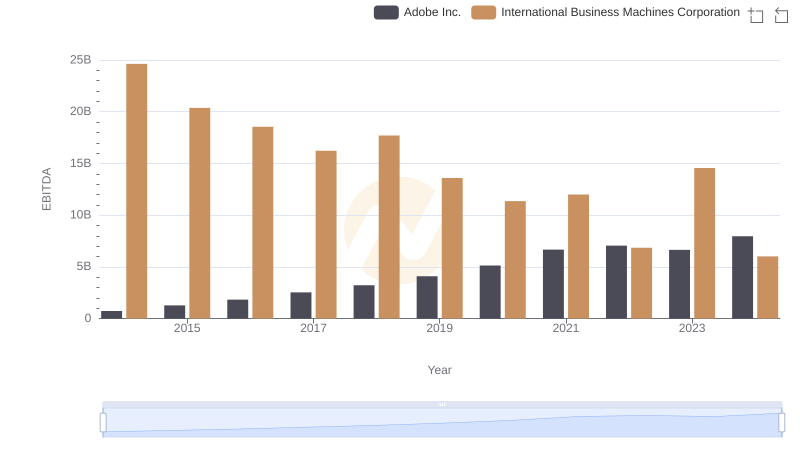
International Business Machines Corporation and Adobe Inc.: A Detailed Examination of EBITDA Performance
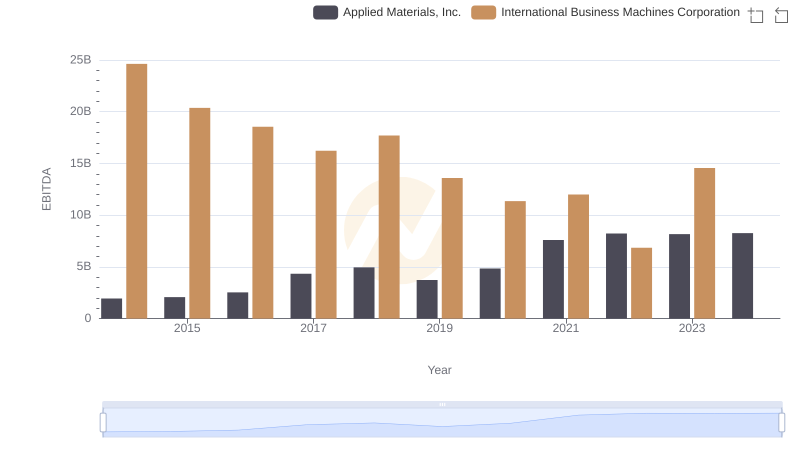
EBITDA Performance Review: International Business Machines Corporation vs Applied Materials, Inc.
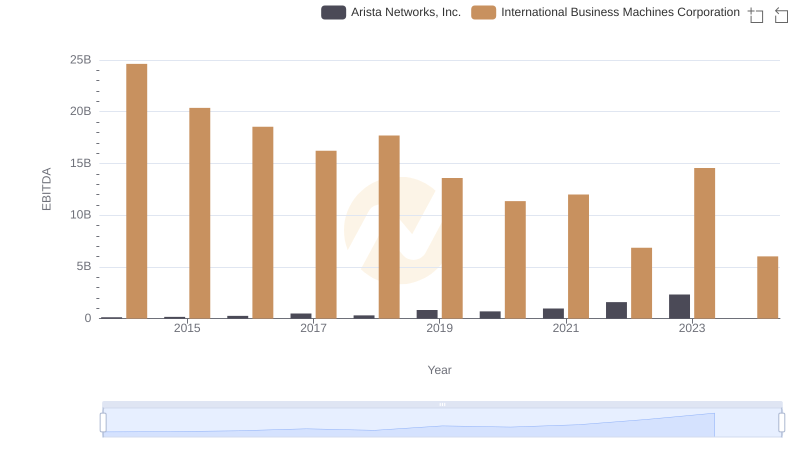
EBITDA Analysis: Evaluating International Business Machines Corporation Against Arista Networks, Inc.
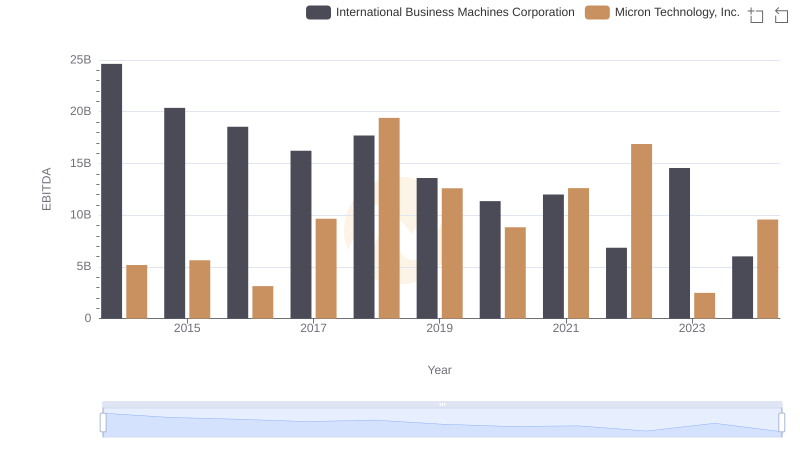
International Business Machines Corporation and Micron Technology, Inc.: A Detailed Examination of EBITDA Performance