| __timestamp | International Business Machines Corporation | QUALCOMM Incorporated |
|---|---|---|
| Wednesday, January 1, 2014 | 92793000000 | 26487000000 |
| Thursday, January 1, 2015 | 81742000000 | 25281000000 |
| Friday, January 1, 2016 | 79920000000 | 23554000000 |
| Sunday, January 1, 2017 | 79139000000 | 22291000000 |
| Monday, January 1, 2018 | 79591000000 | 22732000000 |
| Tuesday, January 1, 2019 | 57714000000 | 24273000000 |
| Wednesday, January 1, 2020 | 55179000000 | 23531000000 |
| Friday, January 1, 2021 | 57351000000 | 33566000000 |
| Saturday, January 1, 2022 | 60530000000 | 44200000000 |
| Sunday, January 1, 2023 | 61860000000 | 35820000000 |
| Monday, January 1, 2024 | 62753000000 | 38962000000 |
Cracking the code
In the ever-evolving tech industry, revenue performance is a key indicator of a company's market position and growth potential. Over the past decade, International Business Machines Corporation (IBM) and QUALCOMM Incorporated have showcased contrasting revenue trajectories. From 2014 to 2024, IBM's revenue has seen a decline of approximately 32%, dropping from its peak in 2014. This trend reflects IBM's strategic shifts and challenges in adapting to the rapidly changing tech landscape.
Conversely, Qualcomm has demonstrated a robust growth trajectory, with its revenue increasing by nearly 47% over the same period. This growth underscores Qualcomm's stronghold in the semiconductor and telecommunications sectors, driven by the global surge in demand for mobile technology and 5G advancements.
As we look to the future, these trends highlight the importance of innovation and adaptability in maintaining competitive advantage in the tech industry.
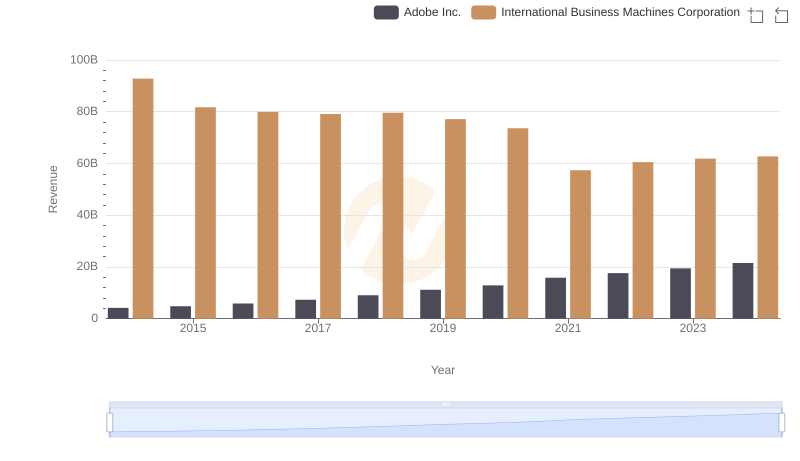
Who Generates More Revenue? International Business Machines Corporation or Adobe Inc.
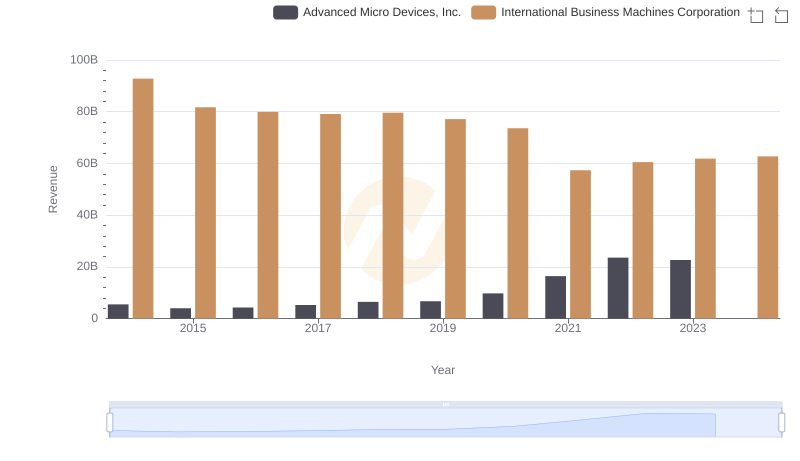
Breaking Down Revenue Trends: International Business Machines Corporation vs Advanced Micro Devices, Inc.
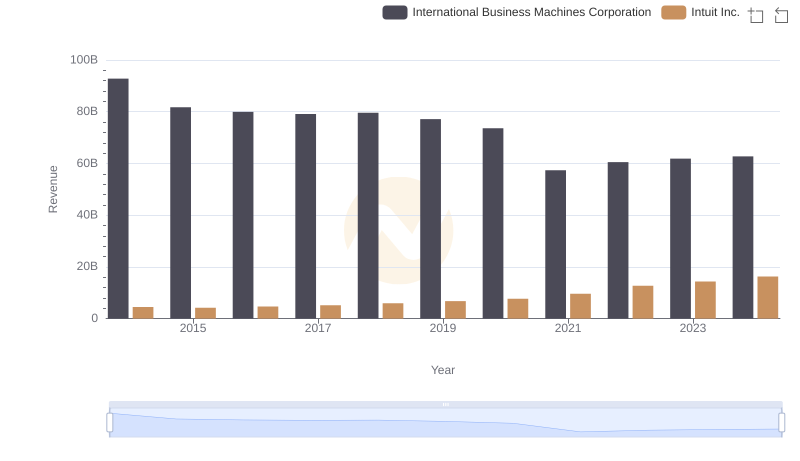
Annual Revenue Comparison: International Business Machines Corporation vs Intuit Inc.
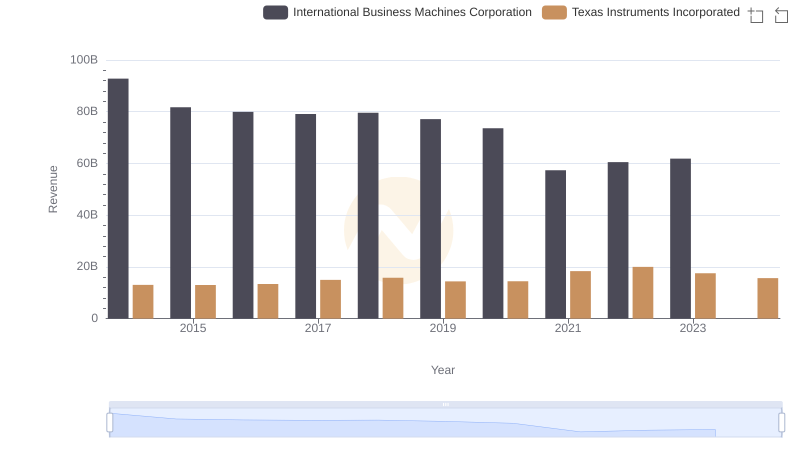
Annual Revenue Comparison: International Business Machines Corporation vs Texas Instruments Incorporated
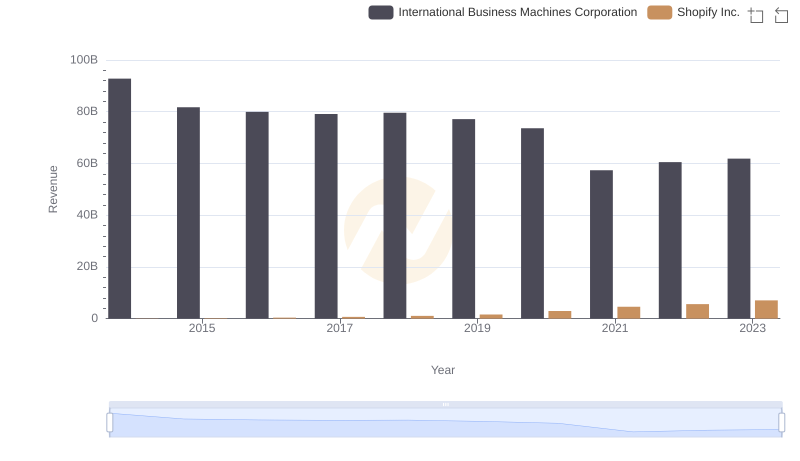
Comparing Revenue Performance: International Business Machines Corporation or Shopify Inc.?
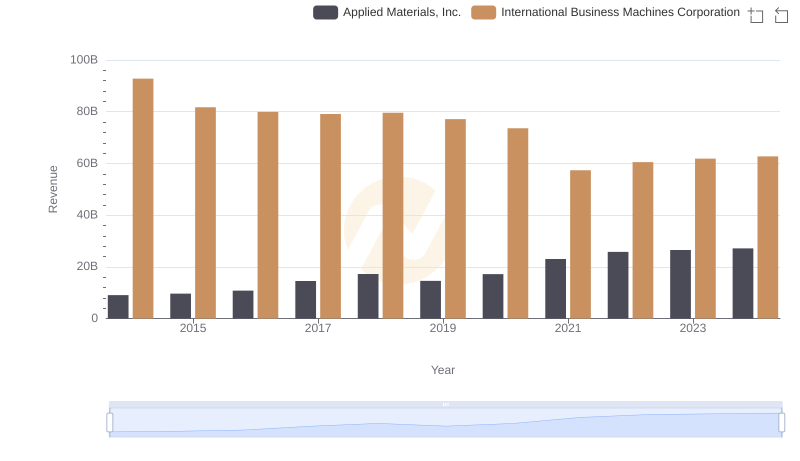
Comparing Revenue Performance: International Business Machines Corporation or Applied Materials, Inc.?
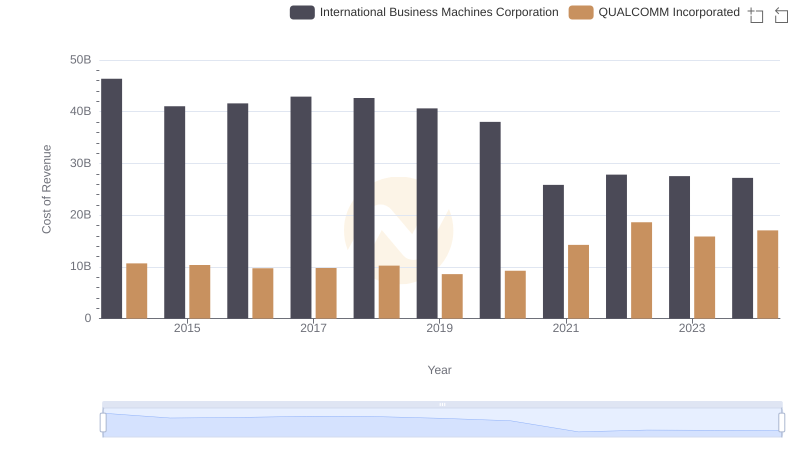
Cost of Revenue Comparison: International Business Machines Corporation vs QUALCOMM Incorporated
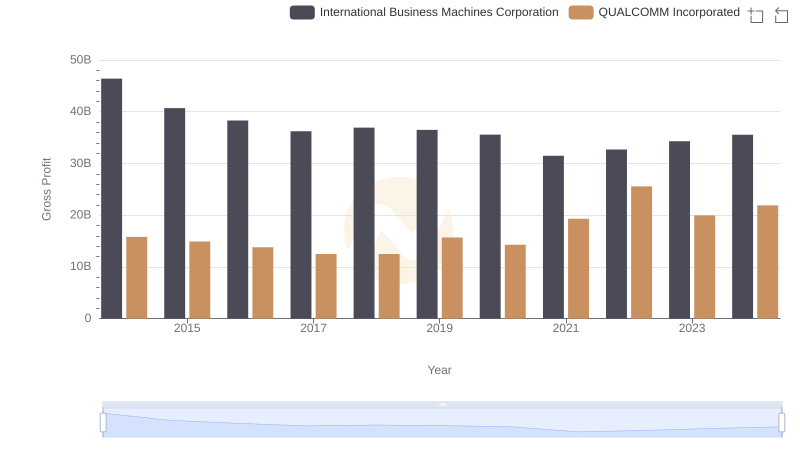
Gross Profit Trends Compared: International Business Machines Corporation vs QUALCOMM Incorporated
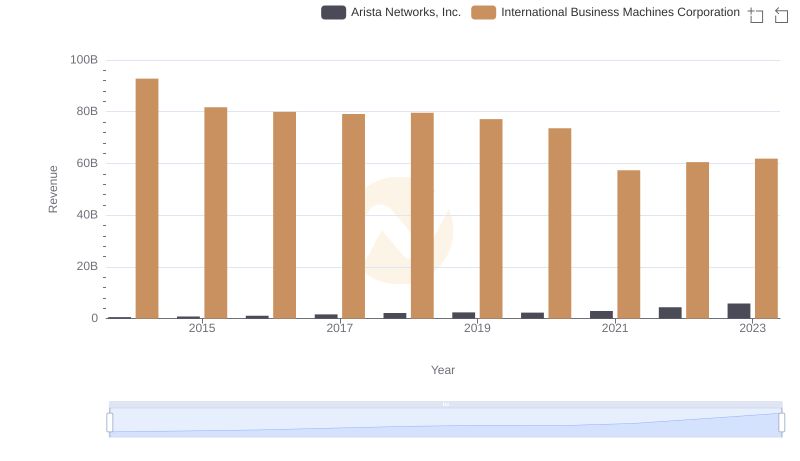
Annual Revenue Comparison: International Business Machines Corporation vs Arista Networks, Inc.
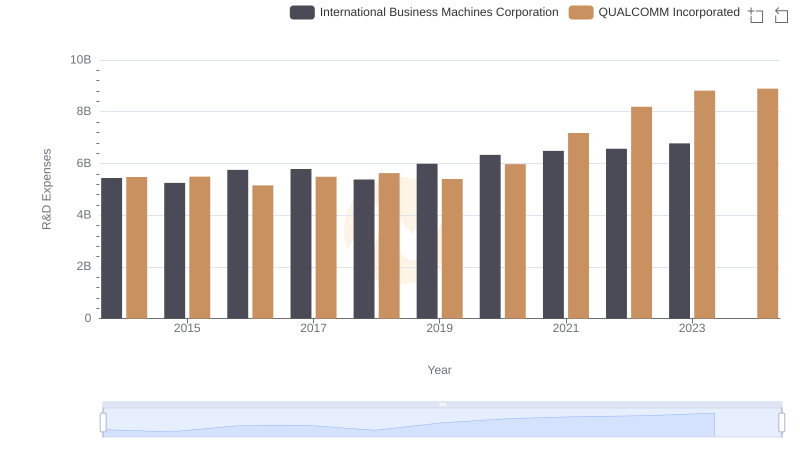
International Business Machines Corporation vs QUALCOMM Incorporated: Strategic Focus on R&D Spending
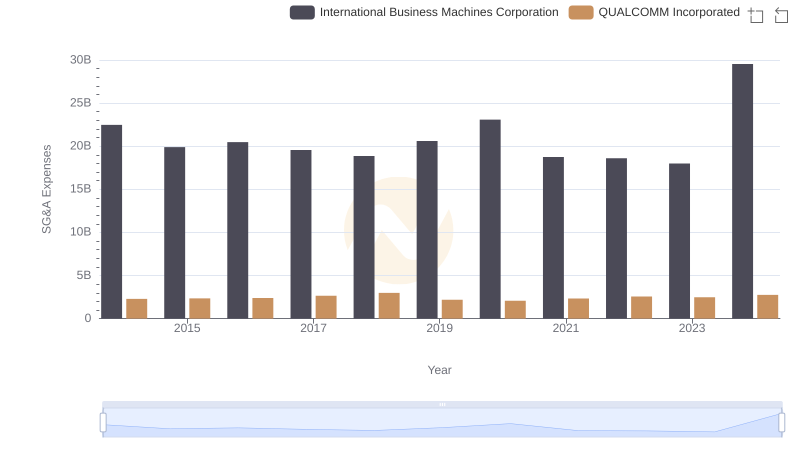
Breaking Down SG&A Expenses: International Business Machines Corporation vs QUALCOMM Incorporated
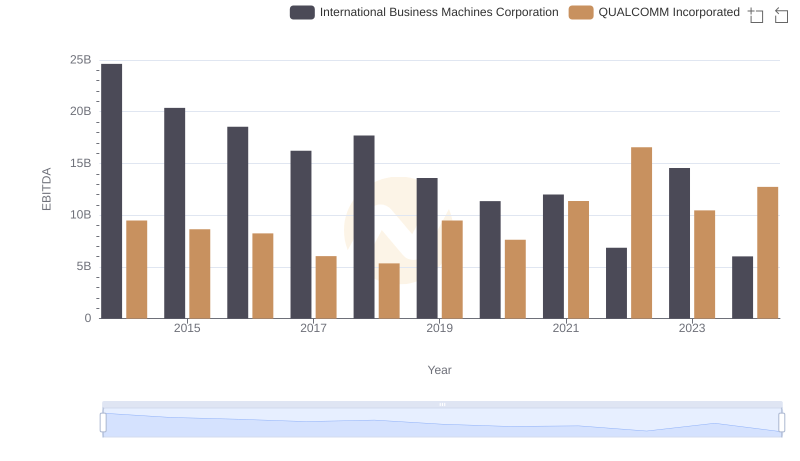
Professional EBITDA Benchmarking: International Business Machines Corporation vs QUALCOMM Incorporated