| __timestamp | HP Inc. | International Business Machines Corporation |
|---|---|---|
| Wednesday, January 1, 2014 | 26615000000 | 46407000000 |
| Thursday, January 1, 2015 | 9939000000 | 40684000000 |
| Friday, January 1, 2016 | 8998000000 | 38516000000 |
| Sunday, January 1, 2017 | 9578000000 | 36943000000 |
| Monday, January 1, 2018 | 10669000000 | 36936000000 |
| Tuesday, January 1, 2019 | 11170000000 | 31533000000 |
| Wednesday, January 1, 2020 | 10437000000 | 30865000000 |
| Friday, January 1, 2021 | 13417000000 | 31486000000 |
| Saturday, January 1, 2022 | 12335000000 | 32687000000 |
| Sunday, January 1, 2023 | 11508000000 | 34300000000 |
| Monday, January 1, 2024 | 11818000000 | 35551000000 |
Unleashing the power of data
In the ever-evolving tech industry, the financial performance of giants like International Business Machines Corporation (IBM) and HP Inc. offers a fascinating glimpse into their strategic maneuvers. Over the past decade, IBM consistently outperformed HP in terms of gross profit, maintaining an average of 37 billion USD annually, nearly three times HP's average of 12 billion USD. However, HP's gross profit saw a significant spike in 2014, reaching a peak of 26.6 billion USD, a remarkable 166% increase compared to its 2015 figures. Meanwhile, IBM's gross profit peaked in 2014 at 46.4 billion USD, before experiencing a gradual decline. By 2023, IBM's gross profit had decreased by 26% from its 2014 peak, while HP showed a more stable trend with a 57% decrease from its 2014 high. These trends reflect the companies' strategic shifts and market dynamics over the years.
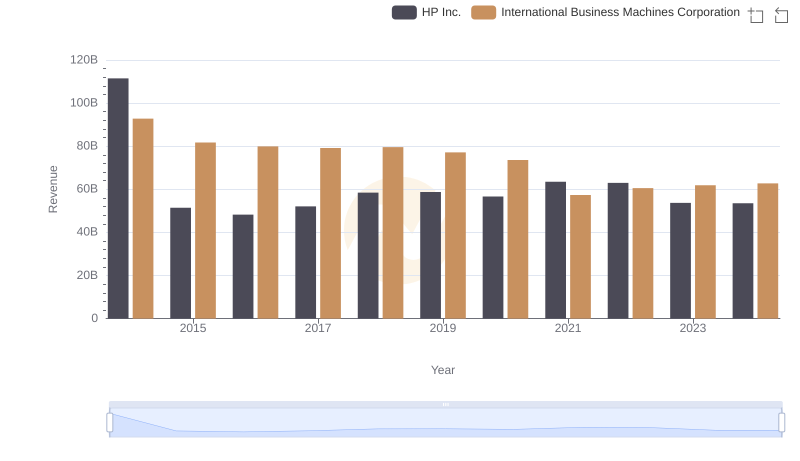
International Business Machines Corporation and HP Inc.: A Comprehensive Revenue Analysis
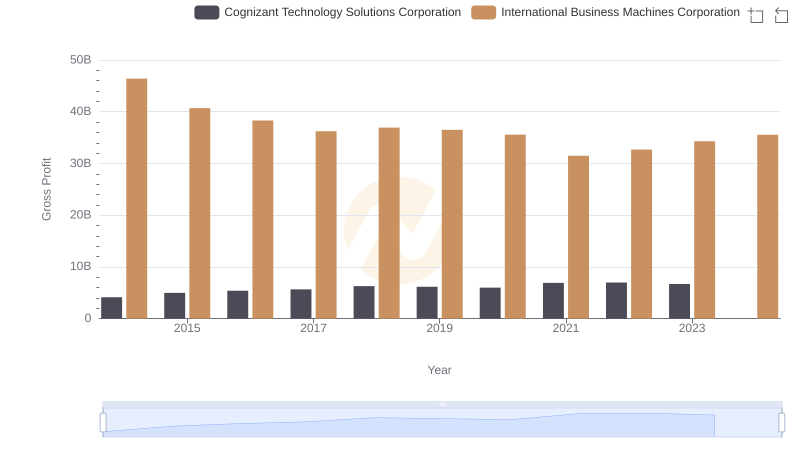
International Business Machines Corporation vs Cognizant Technology Solutions Corporation: A Gross Profit Performance Breakdown
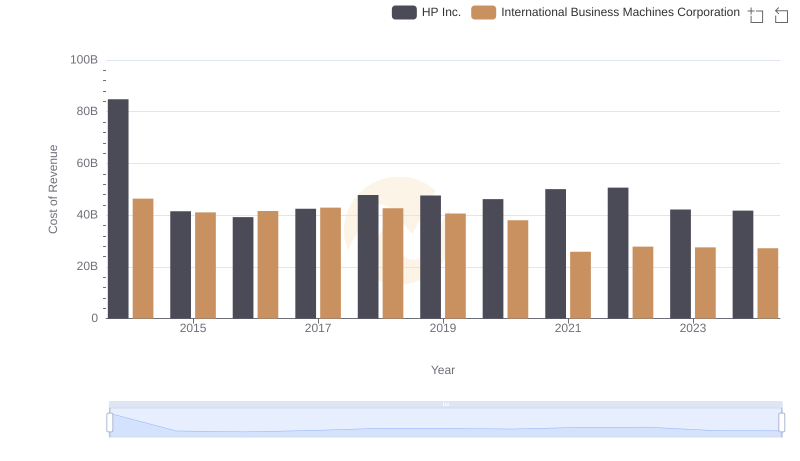
Cost of Revenue: Key Insights for International Business Machines Corporation and HP Inc.
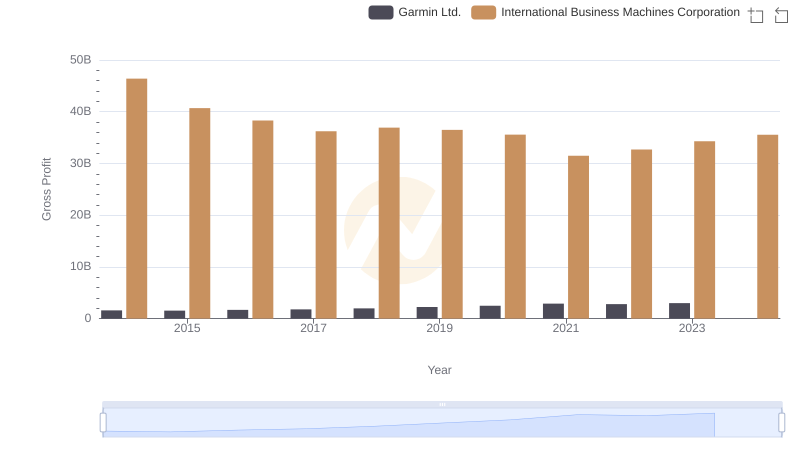
Gross Profit Trends Compared: International Business Machines Corporation vs Garmin Ltd.
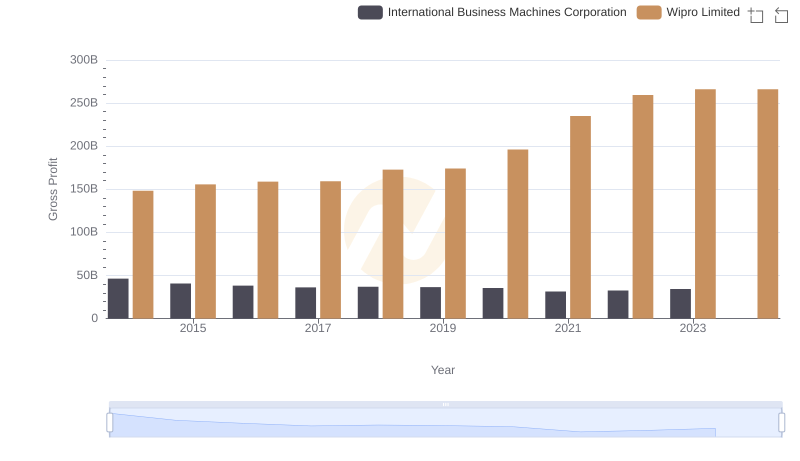
Who Generates Higher Gross Profit? International Business Machines Corporation or Wipro Limited

International Business Machines Corporation and Take-Two Interactive Software, Inc.: A Detailed Gross Profit Analysis
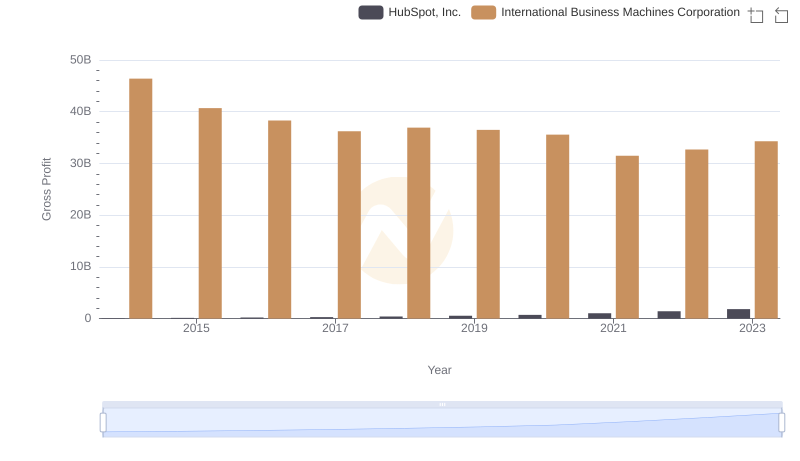
Gross Profit Trends Compared: International Business Machines Corporation vs HubSpot, Inc.
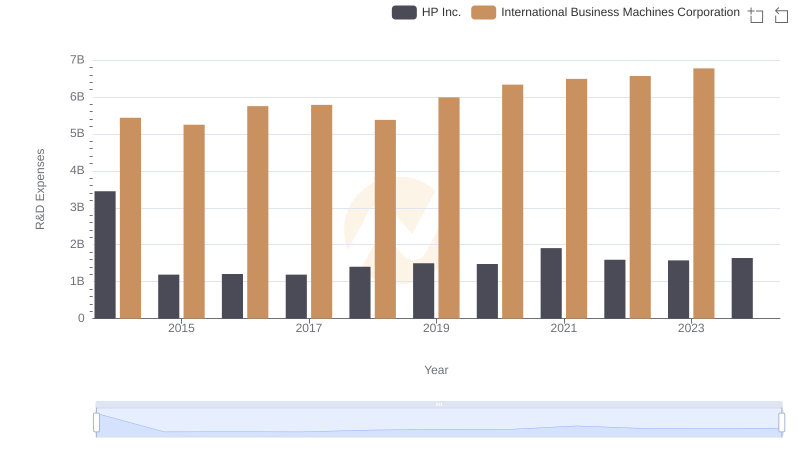
Analyzing R&D Budgets: International Business Machines Corporation vs HP Inc.
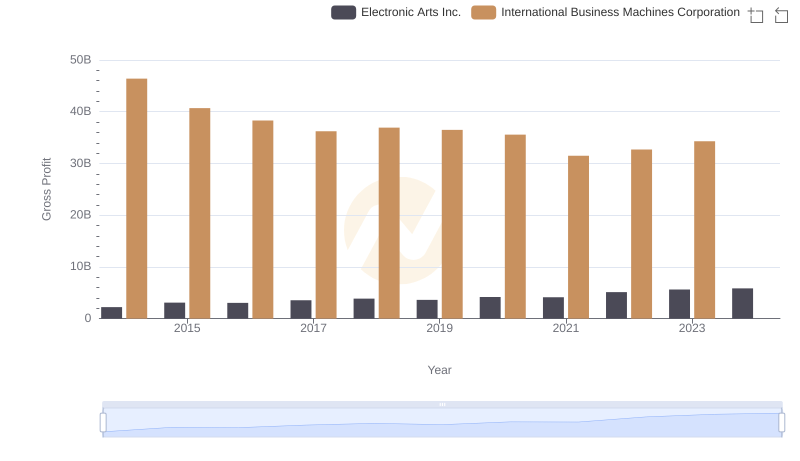
International Business Machines Corporation vs Electronic Arts Inc.: A Gross Profit Performance Breakdown
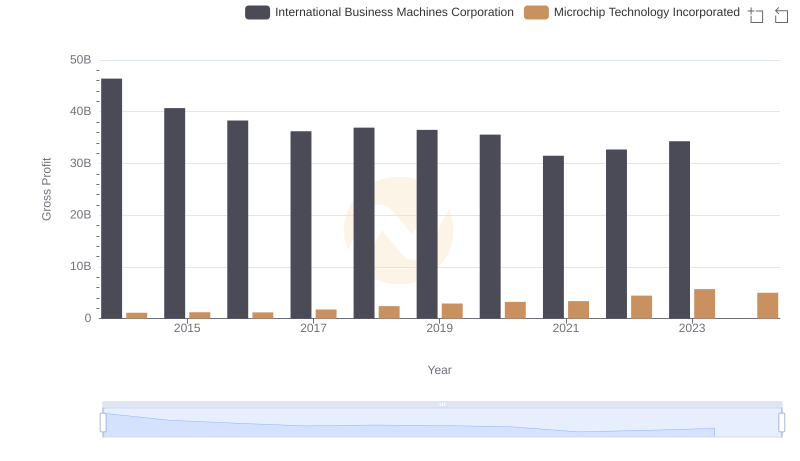
Gross Profit Analysis: Comparing International Business Machines Corporation and Microchip Technology Incorporated
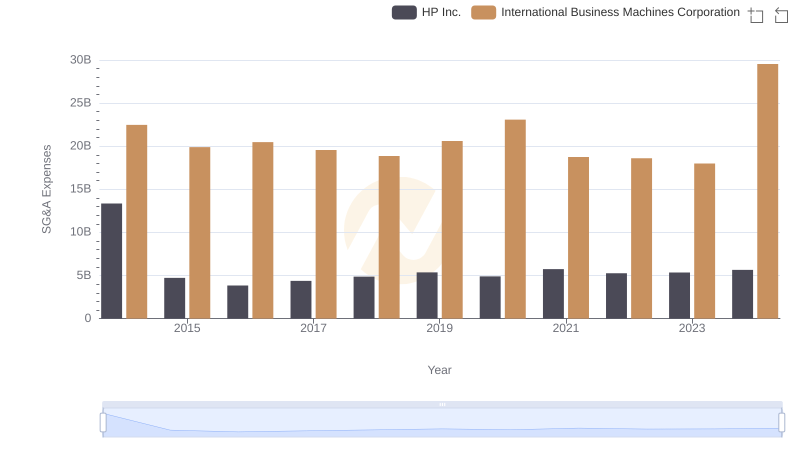
Breaking Down SG&A Expenses: International Business Machines Corporation vs HP Inc.
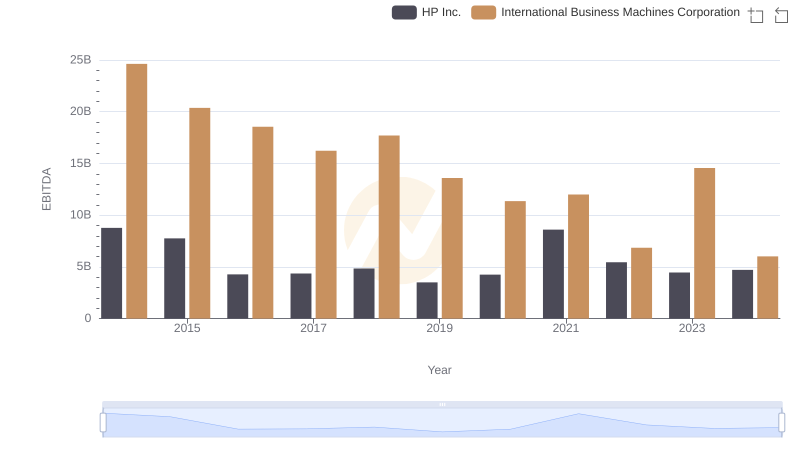
Professional EBITDA Benchmarking: International Business Machines Corporation vs HP Inc.