| __timestamp | Global Payments Inc. | Watsco, Inc. |
|---|---|---|
| Wednesday, January 1, 2014 | 1295014000 | 650655000 |
| Thursday, January 1, 2015 | 1325567000 | 670609000 |
| Friday, January 1, 2016 | 1411096000 | 688952000 |
| Sunday, January 1, 2017 | 1488258000 | 715671000 |
| Monday, January 1, 2018 | 1534297000 | 757452000 |
| Tuesday, January 1, 2019 | 2046672000 | 800328000 |
| Wednesday, January 1, 2020 | 2878878000 | 833051000 |
| Friday, January 1, 2021 | 3391161000 | 1058316000 |
| Saturday, January 1, 2022 | 3524578000 | 1221382000 |
| Sunday, January 1, 2023 | 4073768000 | 1185626000 |
| Monday, January 1, 2024 | 4285307000 | 1262938000 |
Unleashing insights
Over the past decade, Global Payments Inc. and Watsco, Inc. have showcased intriguing trends in their Selling, General, and Administrative (SG&A) expenses. From 2014 to 2023, Global Payments Inc. experienced a staggering 214% increase in SG&A expenses, reflecting its aggressive expansion and strategic investments. In contrast, Watsco, Inc. saw a more modest 82% rise, indicating steady growth in its operations.
In 2014, Global Payments Inc.'s SG&A expenses were nearly double those of Watsco, Inc. By 2023, this gap widened significantly, with Global Payments Inc.'s expenses more than three times higher. This divergence highlights the differing business strategies and market dynamics faced by these companies.
Understanding these trends offers valuable insights into the financial strategies and operational efficiencies of these industry leaders, providing a window into their future trajectories.
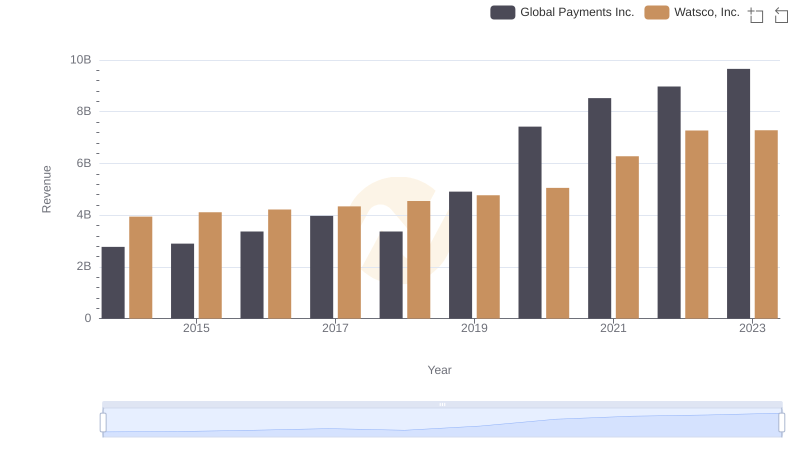
Revenue Showdown: Global Payments Inc. vs Watsco, Inc.
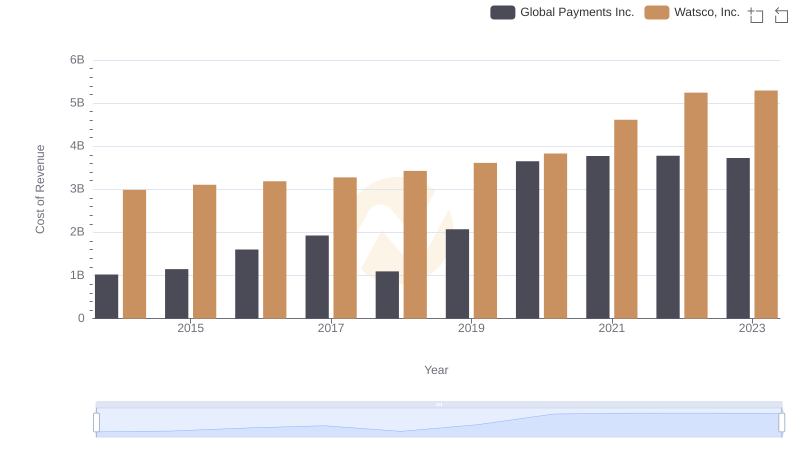
Global Payments Inc. vs Watsco, Inc.: Efficiency in Cost of Revenue Explored
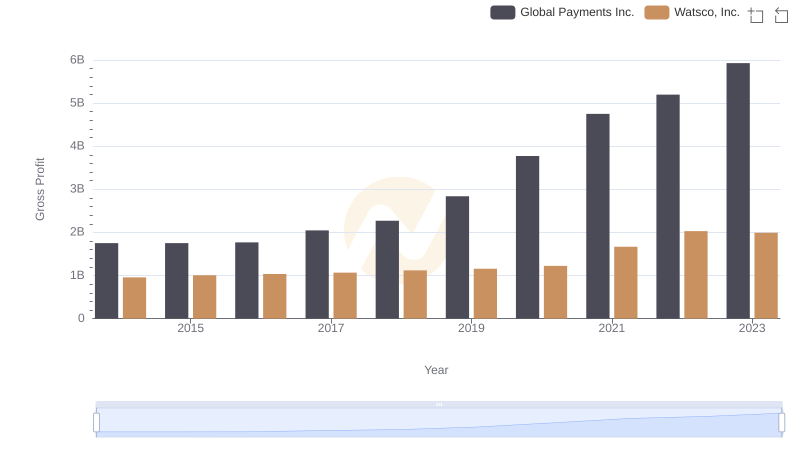
Gross Profit Comparison: Global Payments Inc. and Watsco, Inc. Trends
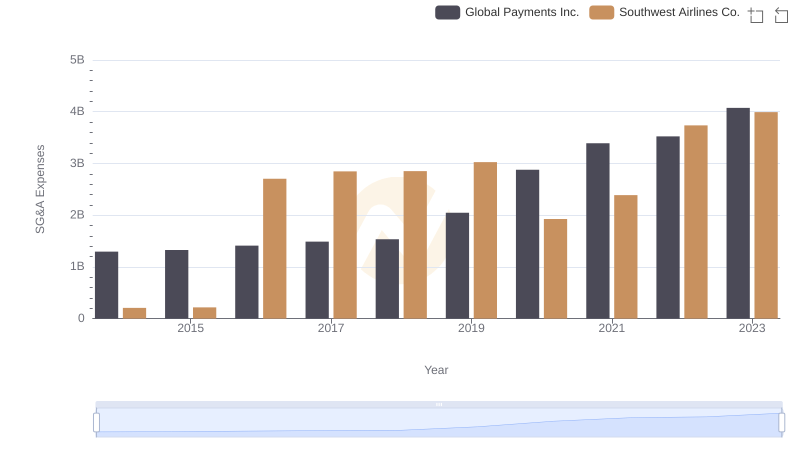
Comparing SG&A Expenses: Global Payments Inc. vs Southwest Airlines Co. Trends and Insights
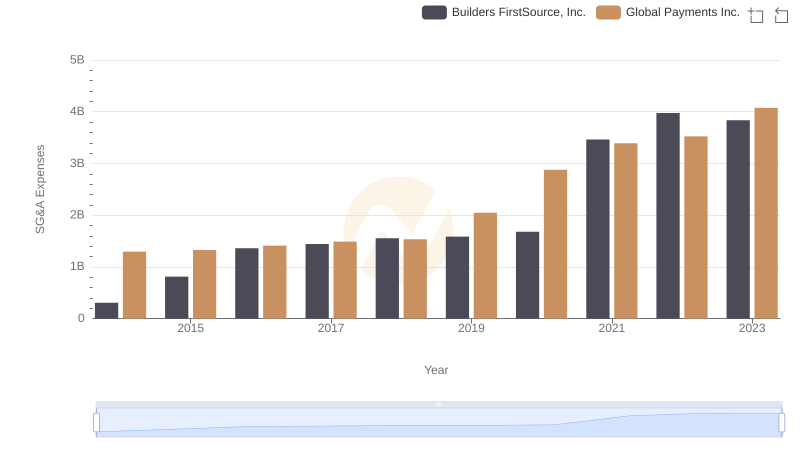
Cost Management Insights: SG&A Expenses for Global Payments Inc. and Builders FirstSource, Inc.
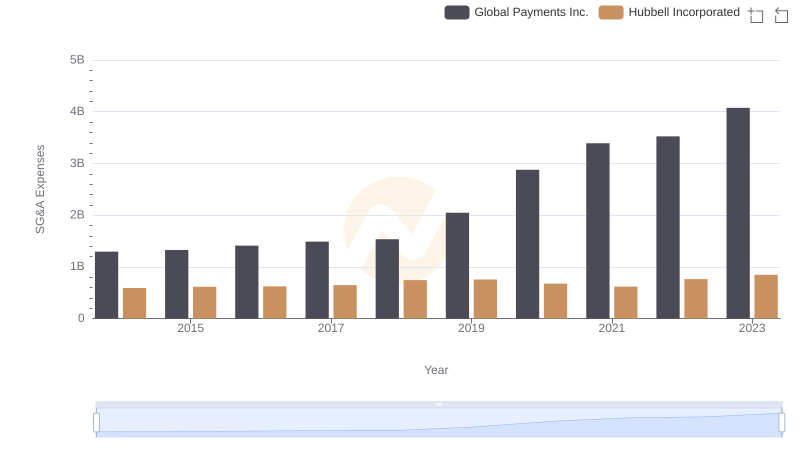
Comparing SG&A Expenses: Global Payments Inc. vs Hubbell Incorporated Trends and Insights
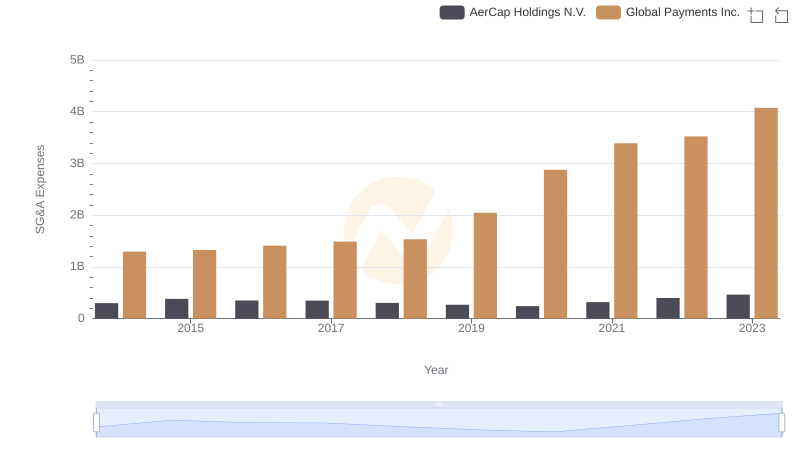
Cost Management Insights: SG&A Expenses for Global Payments Inc. and AerCap Holdings N.V.
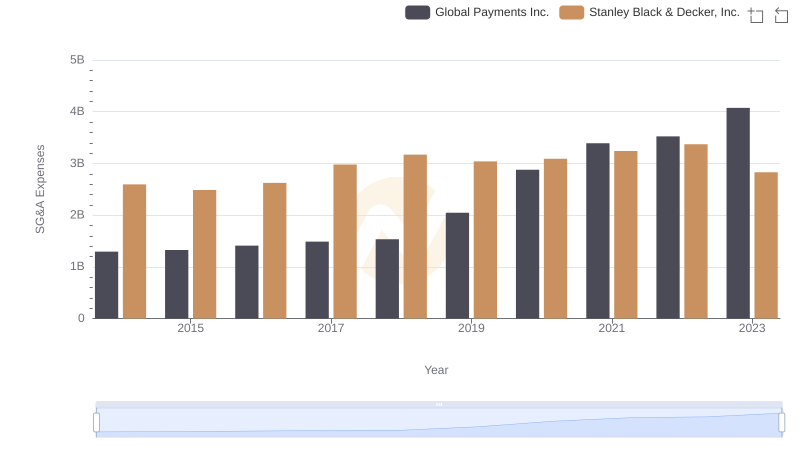
Breaking Down SG&A Expenses: Global Payments Inc. vs Stanley Black & Decker, Inc.
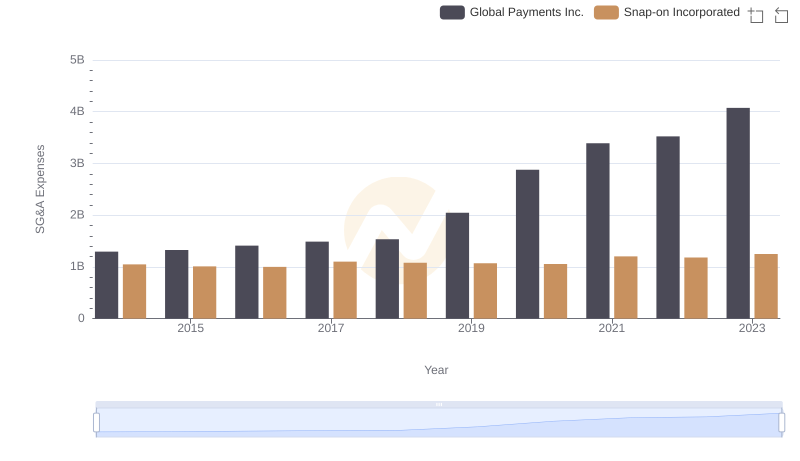
Operational Costs Compared: SG&A Analysis of Global Payments Inc. and Snap-on Incorporated
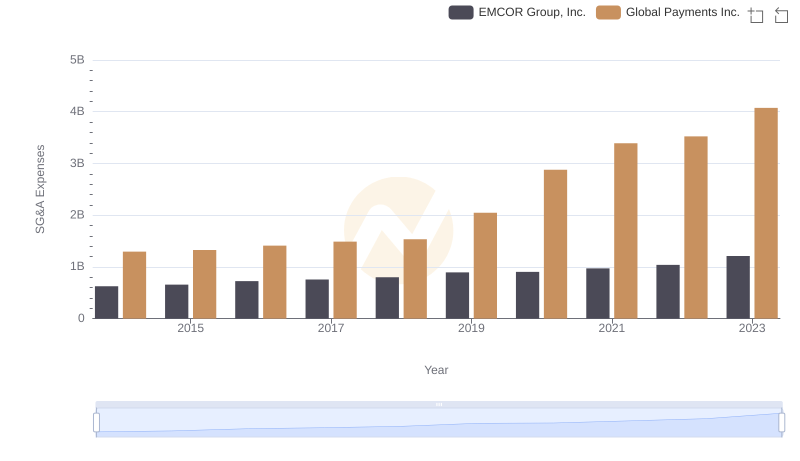
Comparing SG&A Expenses: Global Payments Inc. vs EMCOR Group, Inc. Trends and Insights
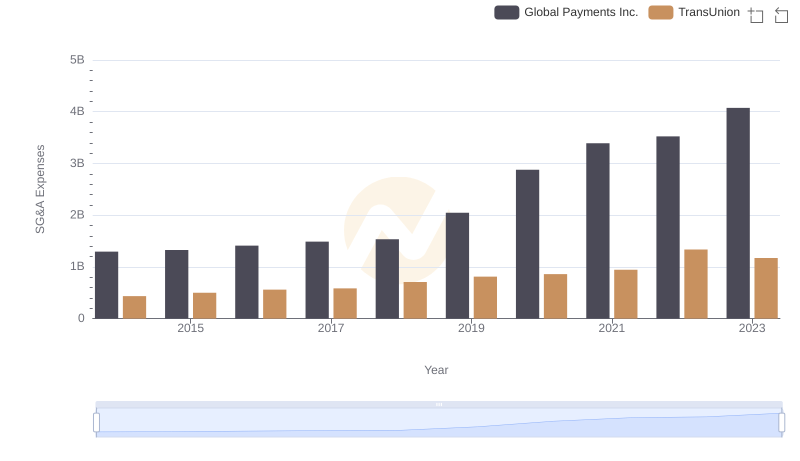
Selling, General, and Administrative Costs: Global Payments Inc. vs TransUnion
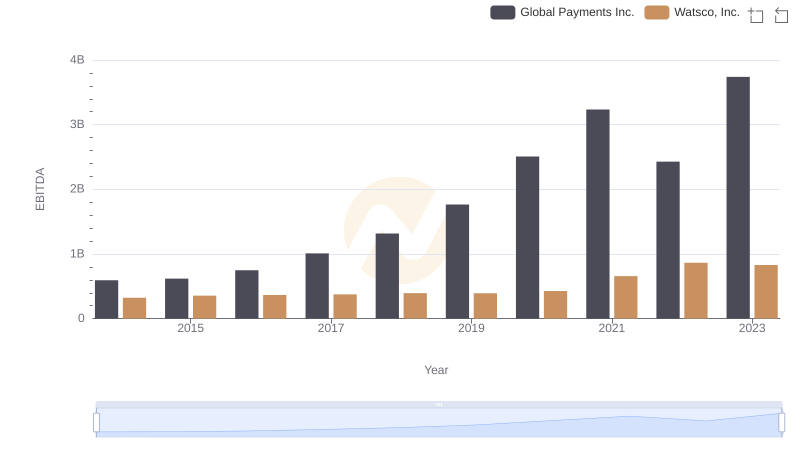
EBITDA Metrics Evaluated: Global Payments Inc. vs Watsco, Inc.