| __timestamp | Equifax Inc. | Global Payments Inc. |
|---|---|---|
| Wednesday, January 1, 2014 | 844700000 | 1022107000 |
| Thursday, January 1, 2015 | 887400000 | 1147639000 |
| Friday, January 1, 2016 | 1113400000 | 1603532000 |
| Sunday, January 1, 2017 | 1210700000 | 1928037000 |
| Monday, January 1, 2018 | 1440400000 | 1095014000 |
| Tuesday, January 1, 2019 | 1521700000 | 2073803000 |
| Wednesday, January 1, 2020 | 1737400000 | 3650727000 |
| Friday, January 1, 2021 | 1980900000 | 3773725000 |
| Saturday, January 1, 2022 | 2177200000 | 3778617000 |
| Sunday, January 1, 2023 | 2335100000 | 3727521000 |
| Monday, January 1, 2024 | 0 | 3760116000 |
Unlocking the unknown
In the ever-evolving financial landscape, understanding cost efficiency is crucial for investors and stakeholders. This analysis compares the cost of revenue efficiency between Equifax Inc. and Global Payments Inc. from 2014 to 2023. Over this period, Global Payments Inc. consistently outpaced Equifax Inc. in cost of revenue, peaking in 2022 with a 70% higher cost than Equifax. Notably, Global Payments saw a significant surge in 2020, with costs rising by 76% from the previous year, reflecting strategic investments or market expansions. Meanwhile, Equifax's cost of revenue grew steadily, with a notable 30% increase from 2018 to 2023. This trend highlights the differing operational strategies and market responses of these two giants. As the financial sector continues to adapt, these insights provide a window into the efficiency and strategic priorities of leading companies.
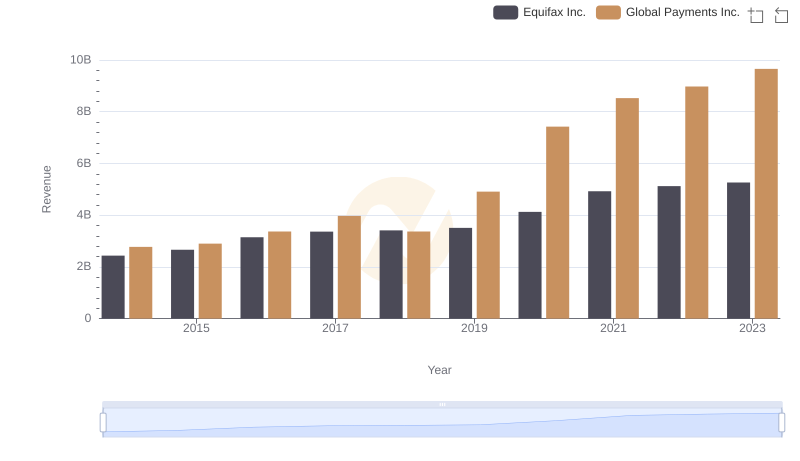
Comparing Revenue Performance: Equifax Inc. or Global Payments Inc.?
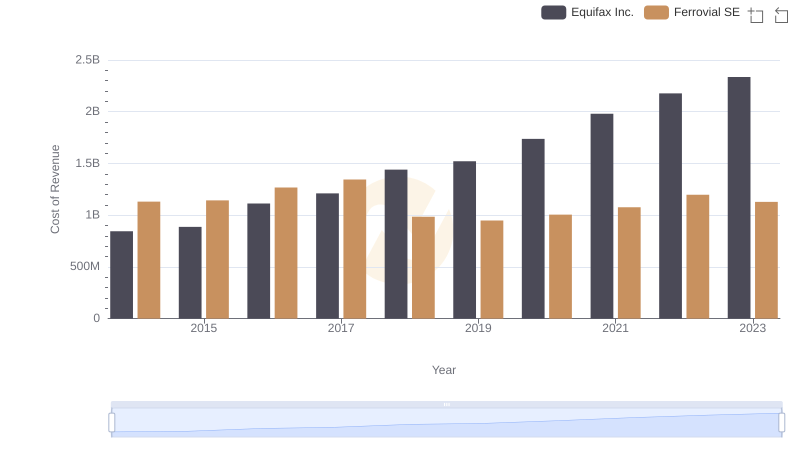
Comparing Cost of Revenue Efficiency: Equifax Inc. vs Ferrovial SE
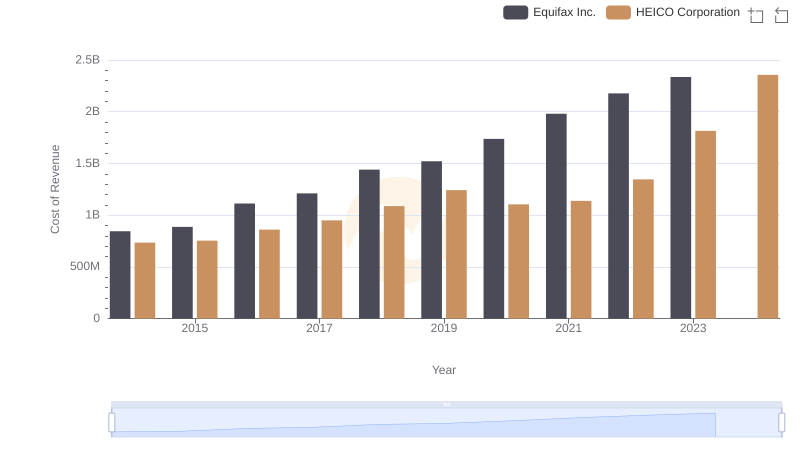
Equifax Inc. vs HEICO Corporation: Efficiency in Cost of Revenue Explored
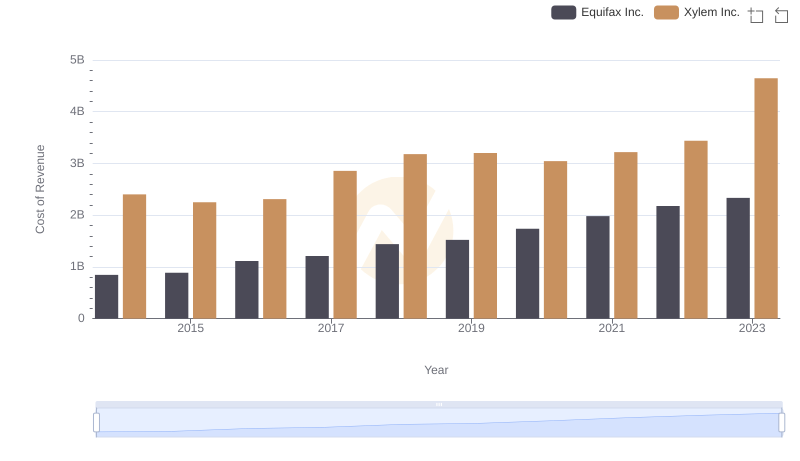
Analyzing Cost of Revenue: Equifax Inc. and Xylem Inc.
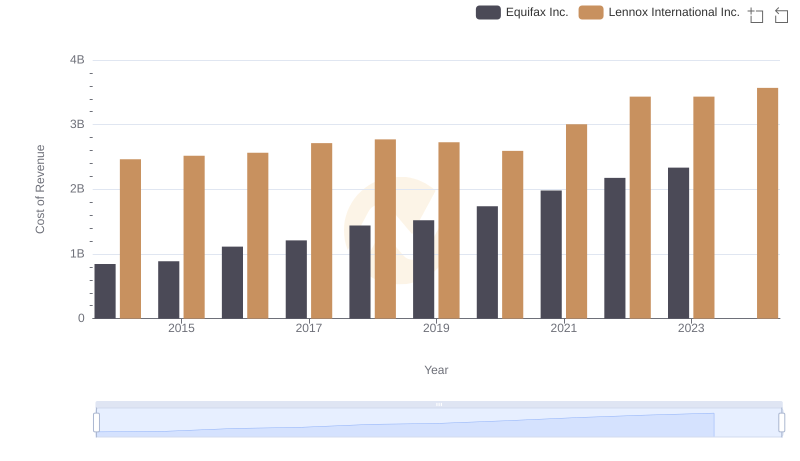
Cost of Revenue Comparison: Equifax Inc. vs Lennox International Inc.
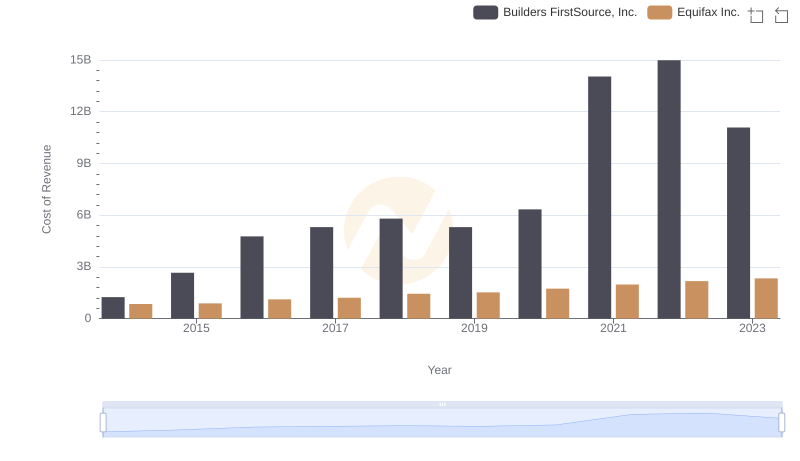
Cost Insights: Breaking Down Equifax Inc. and Builders FirstSource, Inc.'s Expenses
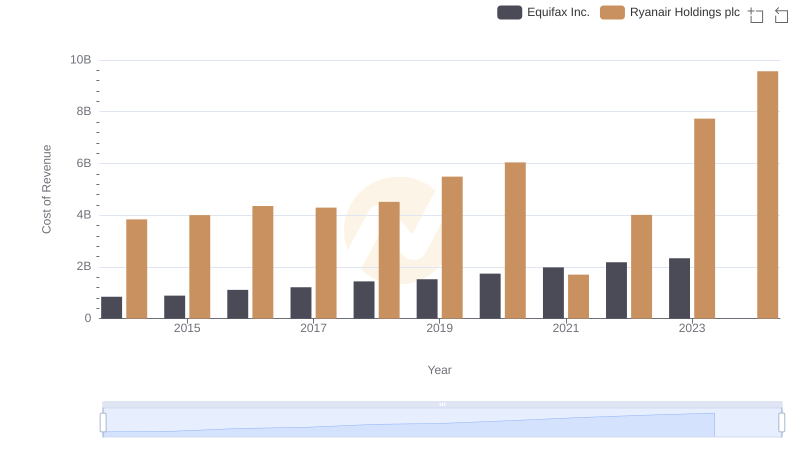
Equifax Inc. vs Ryanair Holdings plc: Efficiency in Cost of Revenue Explored
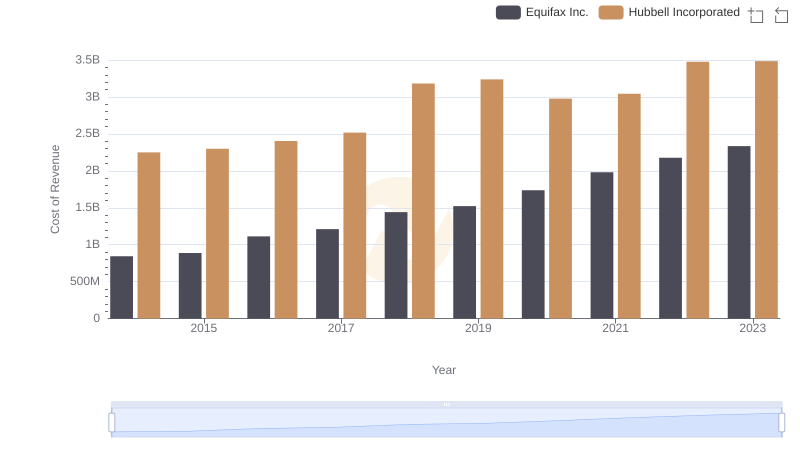
Cost Insights: Breaking Down Equifax Inc. and Hubbell Incorporated's Expenses
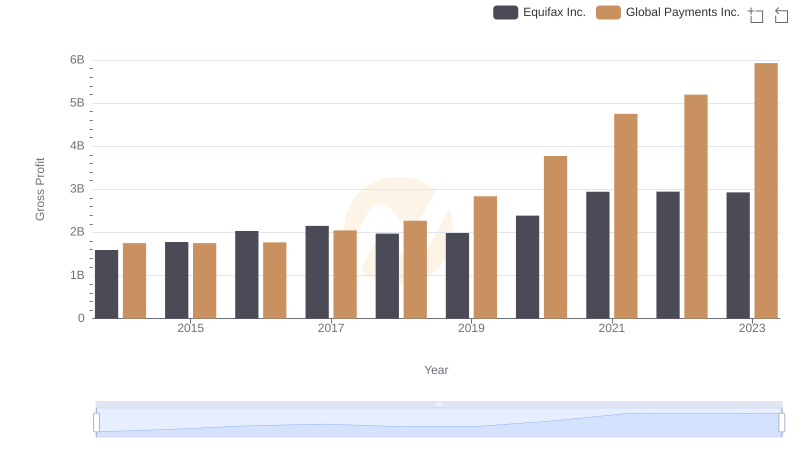
Who Generates Higher Gross Profit? Equifax Inc. or Global Payments Inc.
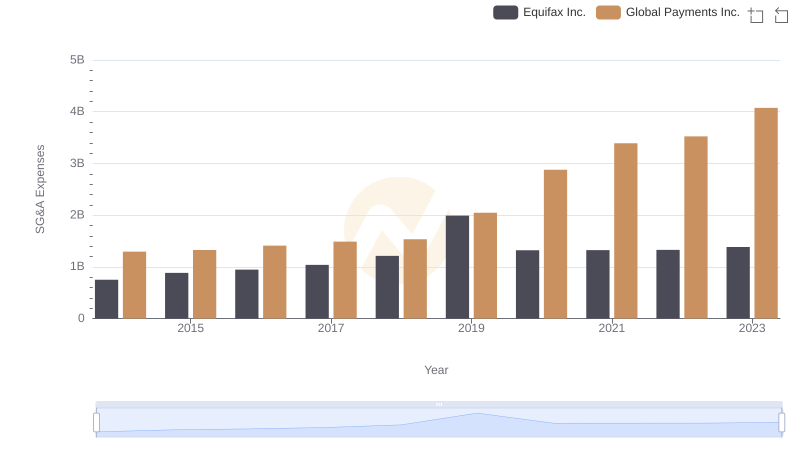
Breaking Down SG&A Expenses: Equifax Inc. vs Global Payments Inc.