| __timestamp | Avery Dennison Corporation | EMCOR Group, Inc. |
|---|---|---|
| Wednesday, January 1, 2014 | 1155300000 | 626478000 |
| Thursday, January 1, 2015 | 1108100000 | 656573000 |
| Friday, January 1, 2016 | 1097500000 | 725538000 |
| Sunday, January 1, 2017 | 1123200000 | 757062000 |
| Monday, January 1, 2018 | 1127500000 | 799157000 |
| Tuesday, January 1, 2019 | 1080400000 | 893453000 |
| Wednesday, January 1, 2020 | 1060500000 | 903584000 |
| Friday, January 1, 2021 | 1248500000 | 970937000 |
| Saturday, January 1, 2022 | 1330800000 | 1038717000 |
| Sunday, January 1, 2023 | 1177900000 | 1211233000 |
| Monday, January 1, 2024 | 1415300000 |
Igniting the spark of knowledge
In the ever-evolving landscape of corporate finance, understanding the nuances of Selling, General, and Administrative (SG&A) expenses is crucial. Over the past decade, from 2014 to 2023, EMCOR Group, Inc. and Avery Dennison Corporation have showcased distinct trajectories in their SG&A expenditures. Avery Dennison Corporation, a leader in labeling and packaging materials, has seen its SG&A expenses grow by approximately 2% annually, peaking in 2022. In contrast, EMCOR Group, Inc., a construction and facilities services giant, has experienced a more dynamic increase, with a notable 93% rise from 2014 to 2023. This divergence highlights the strategic differences in managing operational costs between the two companies. As businesses navigate the complexities of the modern economy, these insights into SG&A trends offer valuable lessons in cost management and efficiency.
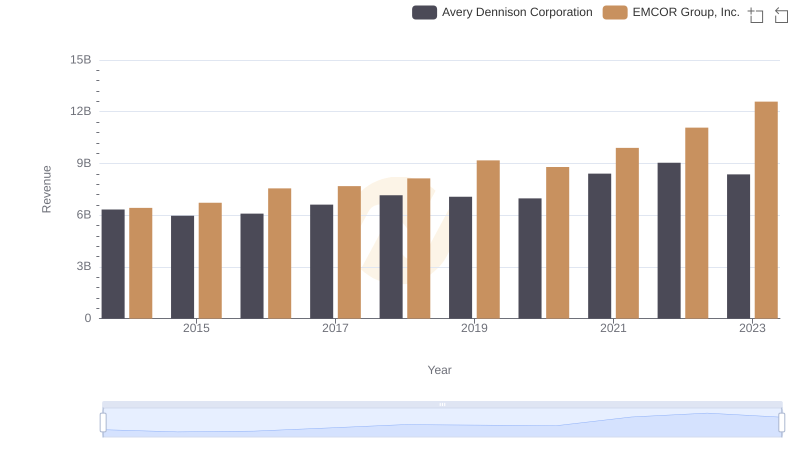
Comparing Revenue Performance: EMCOR Group, Inc. or Avery Dennison Corporation?
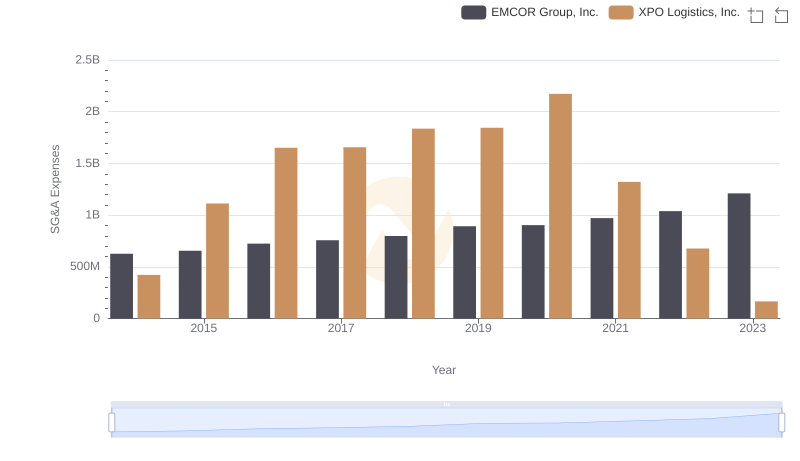
Selling, General, and Administrative Costs: EMCOR Group, Inc. vs XPO Logistics, Inc.
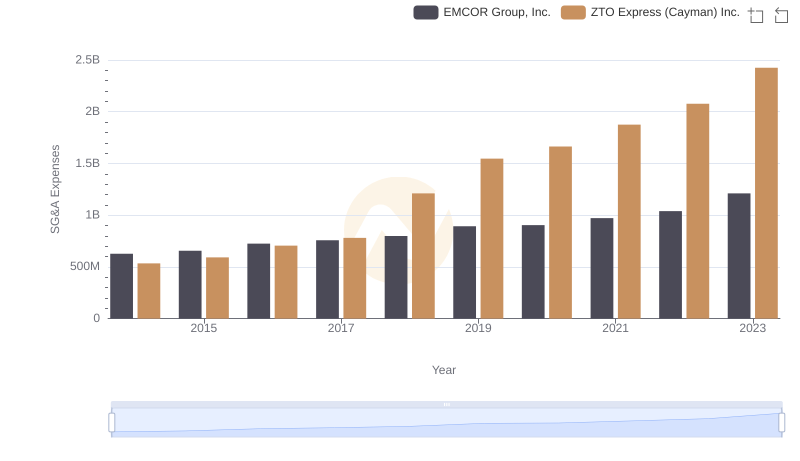
Comparing SG&A Expenses: EMCOR Group, Inc. vs ZTO Express (Cayman) Inc. Trends and Insights
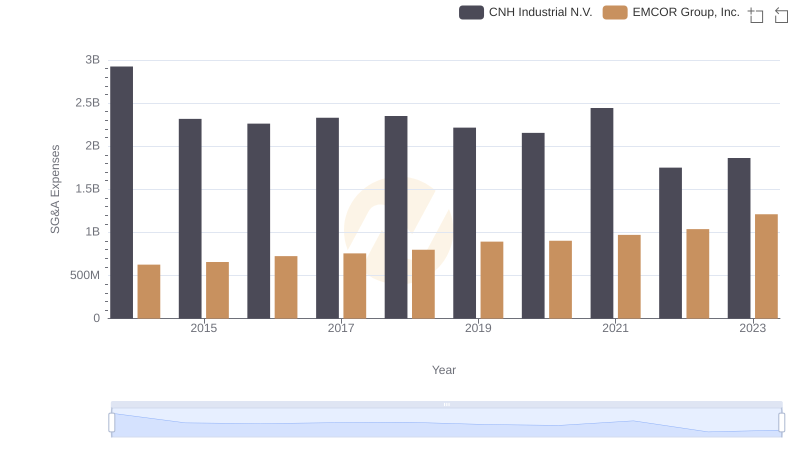
EMCOR Group, Inc. or CNH Industrial N.V.: Who Manages SG&A Costs Better?
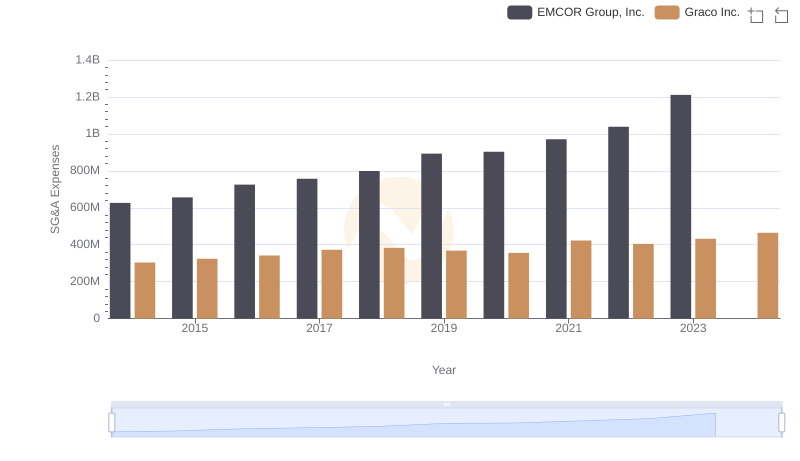
Breaking Down SG&A Expenses: EMCOR Group, Inc. vs Graco Inc.
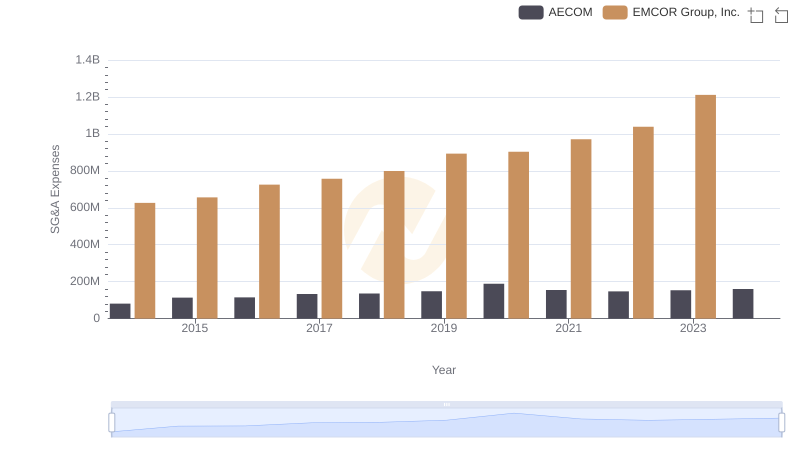
Comparing SG&A Expenses: EMCOR Group, Inc. vs AECOM Trends and Insights
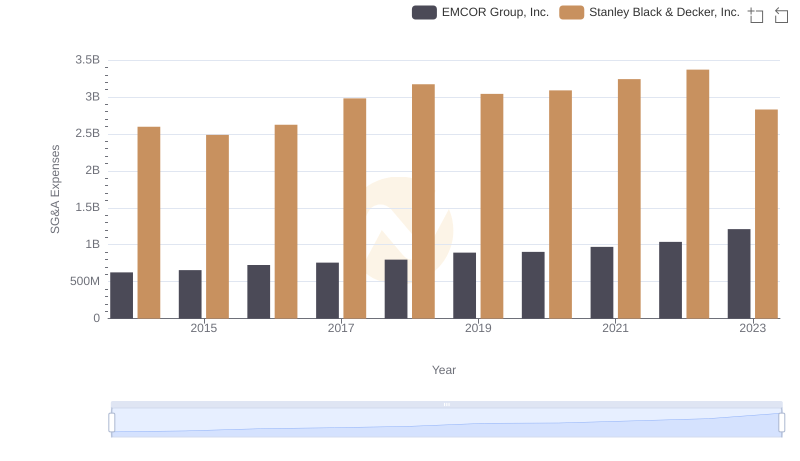
Selling, General, and Administrative Costs: EMCOR Group, Inc. vs Stanley Black & Decker, Inc.