| __timestamp | Axon Enterprise, Inc. | L3Harris Technologies, Inc. |
|---|---|---|
| Wednesday, January 1, 2014 | 62977000 | 2370000000 |
| Thursday, January 1, 2015 | 69245000 | 3832000000 |
| Friday, January 1, 2016 | 97709000 | 3854000000 |
| Sunday, January 1, 2017 | 136710000 | 4066000000 |
| Monday, January 1, 2018 | 161485000 | 4467000000 |
| Tuesday, January 1, 2019 | 223574000 | 13452000000 |
| Wednesday, January 1, 2020 | 264672000 | 12886000000 |
| Friday, January 1, 2021 | 322471000 | 12438000000 |
| Saturday, January 1, 2022 | 461297000 | 12135000000 |
| Sunday, January 1, 2023 | 608009000 | 14306000000 |
| Monday, January 1, 2024 | 15801000000 |
Unleashing insights
In the ever-evolving landscape of technology and defense, understanding cost efficiency is crucial. This analysis delves into the cost of revenue trends for Axon Enterprise, Inc. and L3Harris Technologies, Inc. from 2014 to 2023. Over this period, Axon Enterprise, Inc. has seen a remarkable increase in its cost of revenue, growing by approximately 866%, from $63 million in 2014 to $608 million in 2023. In contrast, L3Harris Technologies, Inc. experienced a more modest growth of 504%, with costs rising from $2.37 billion to $14.31 billion.
This data highlights the differing scales and growth trajectories of these two industry giants. While Axon Enterprise, Inc. shows rapid expansion, L3Harris Technologies, Inc. maintains a larger, more stable cost structure. These insights provide a window into the strategic priorities and market positioning of each company.
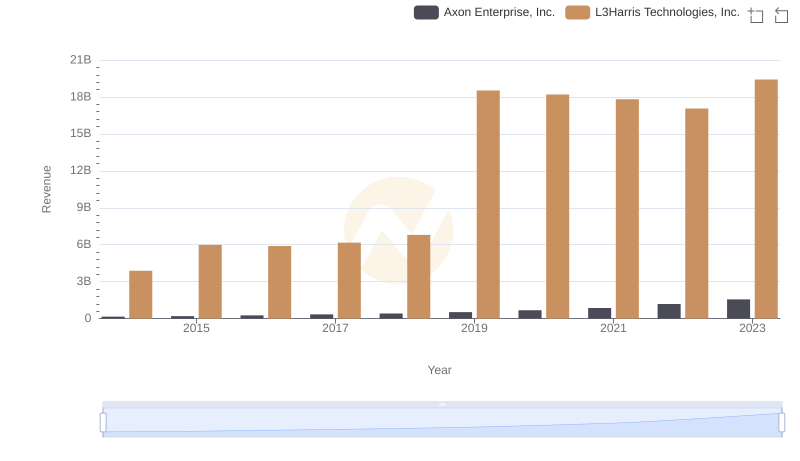
Annual Revenue Comparison: Axon Enterprise, Inc. vs L3Harris Technologies, Inc.

Cost Insights: Breaking Down Axon Enterprise, Inc. and Fastenal Company's Expenses
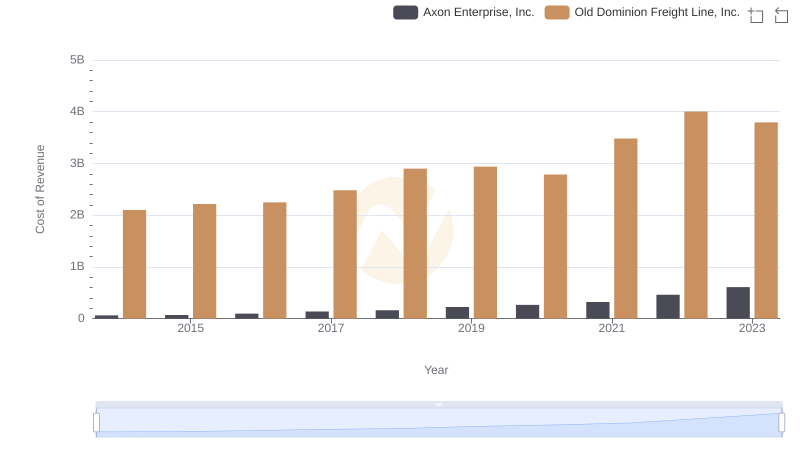
Cost of Revenue Trends: Axon Enterprise, Inc. vs Old Dominion Freight Line, Inc.
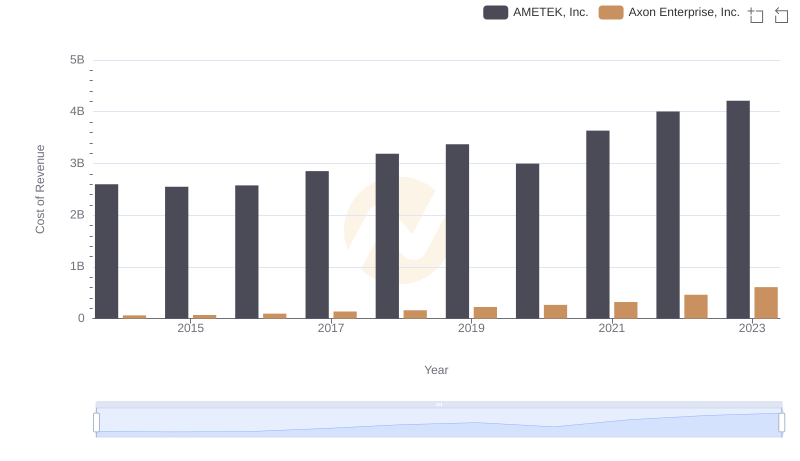
Cost of Revenue: Key Insights for Axon Enterprise, Inc. and AMETEK, Inc.
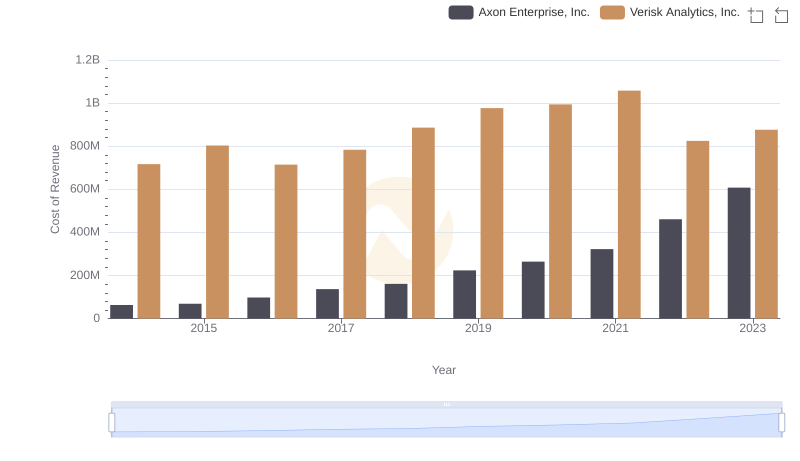
Comparing Cost of Revenue Efficiency: Axon Enterprise, Inc. vs Verisk Analytics, Inc.

Cost of Revenue Trends: Axon Enterprise, Inc. vs Ferguson plc
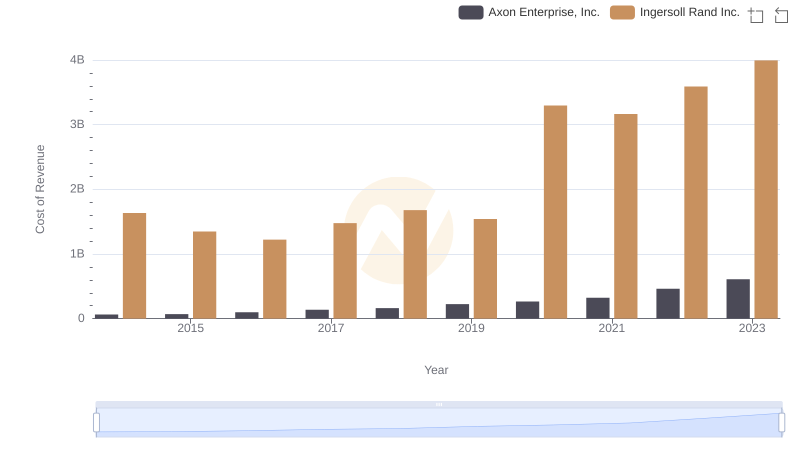
Analyzing Cost of Revenue: Axon Enterprise, Inc. and Ingersoll Rand Inc.
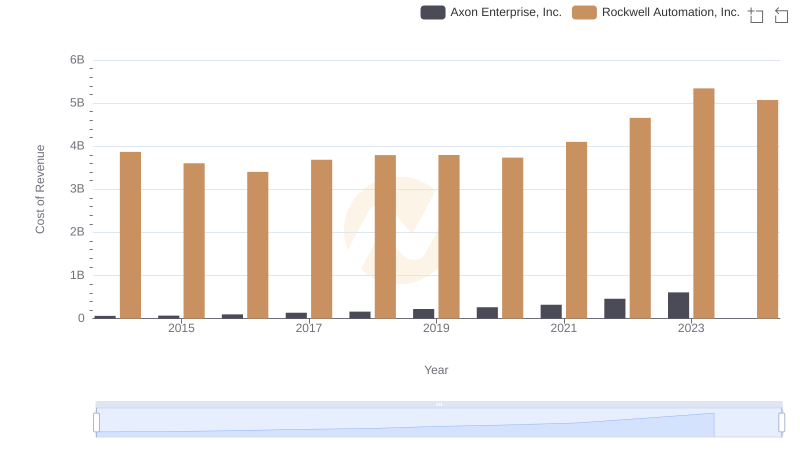
Cost of Revenue Comparison: Axon Enterprise, Inc. vs Rockwell Automation, Inc.
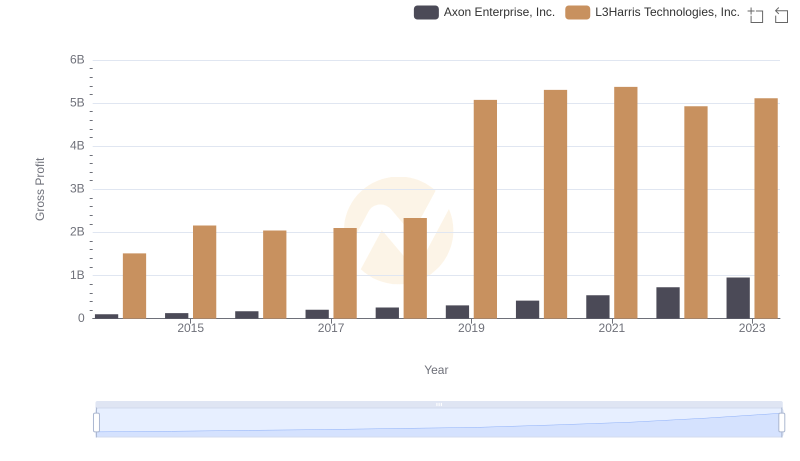
Axon Enterprise, Inc. vs L3Harris Technologies, Inc.: A Gross Profit Performance Breakdown
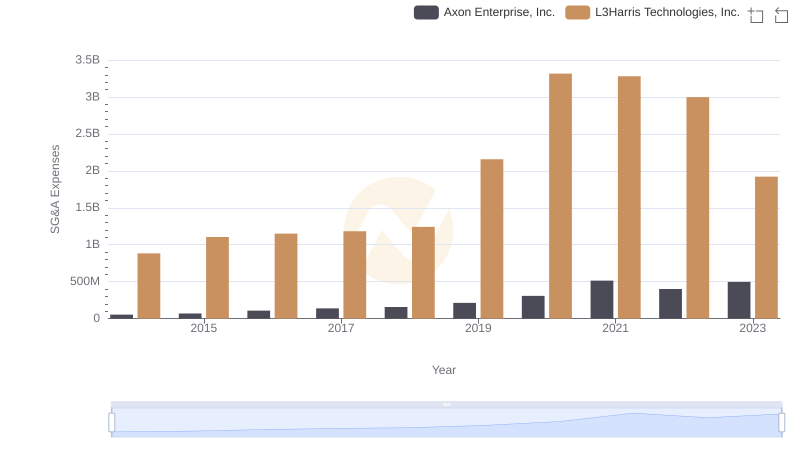
Selling, General, and Administrative Costs: Axon Enterprise, Inc. vs L3Harris Technologies, Inc.