| __timestamp | Axon Enterprise, Inc. | Ingersoll Rand Inc. |
|---|---|---|
| Wednesday, January 1, 2014 | 62977000 | 1633224000 |
| Thursday, January 1, 2015 | 69245000 | 1347800000 |
| Friday, January 1, 2016 | 97709000 | 1222705000 |
| Sunday, January 1, 2017 | 136710000 | 1477500000 |
| Monday, January 1, 2018 | 161485000 | 1677300000 |
| Tuesday, January 1, 2019 | 223574000 | 1540200000 |
| Wednesday, January 1, 2020 | 264672000 | 3296800000 |
| Friday, January 1, 2021 | 322471000 | 3163900000 |
| Saturday, January 1, 2022 | 461297000 | 3590700000 |
| Sunday, January 1, 2023 | 608009000 | 3993900000 |
| Monday, January 1, 2024 | 0 |
Unleashing insights
Over the past decade, the cost of revenue for Axon Enterprise, Inc. and Ingersoll Rand Inc. has shown significant trends, reflecting their strategic financial maneuvers. Axon Enterprise, Inc., known for its innovative public safety technologies, has seen its cost of revenue grow nearly tenfold from 2014 to 2023, indicating a robust expansion in its operations. In contrast, Ingersoll Rand Inc., a leader in industrial solutions, has maintained a more stable trajectory, with its cost of revenue increasing by approximately 145% over the same period.
In 2020, both companies experienced notable spikes in their cost of revenue, with Ingersoll Rand Inc. reaching its peak at nearly 3.3 billion, a 115% increase from 2019. This surge could be attributed to global economic shifts and increased demand for industrial products. Meanwhile, Axon Enterprise, Inc. continued its upward trend, reflecting its aggressive market expansion and investment in new technologies.
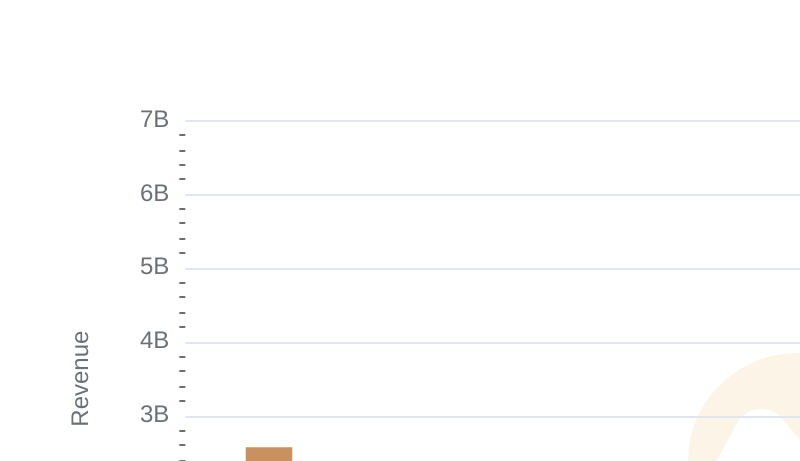
Axon Enterprise, Inc. vs Ingersoll Rand Inc.: Annual Revenue Growth Compared
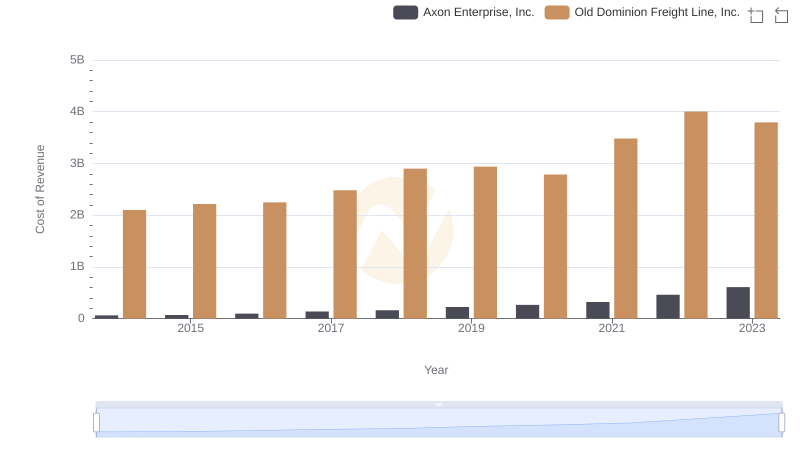
Cost of Revenue Trends: Axon Enterprise, Inc. vs Old Dominion Freight Line, Inc.
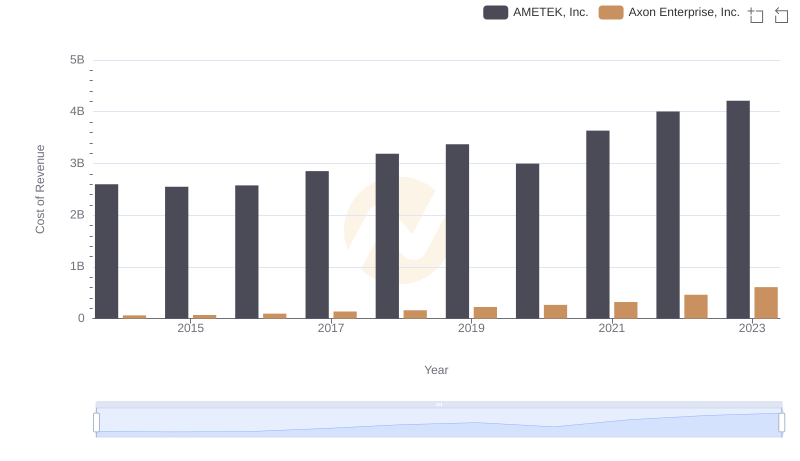
Cost of Revenue: Key Insights for Axon Enterprise, Inc. and AMETEK, Inc.
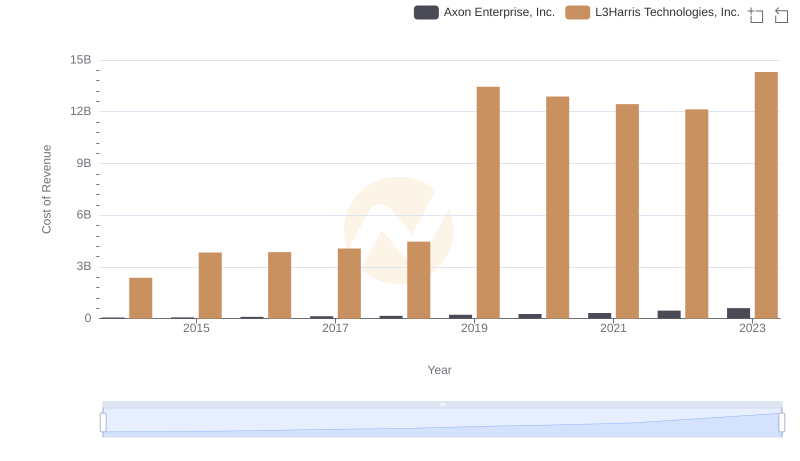
Axon Enterprise, Inc. vs L3Harris Technologies, Inc.: Efficiency in Cost of Revenue Explored
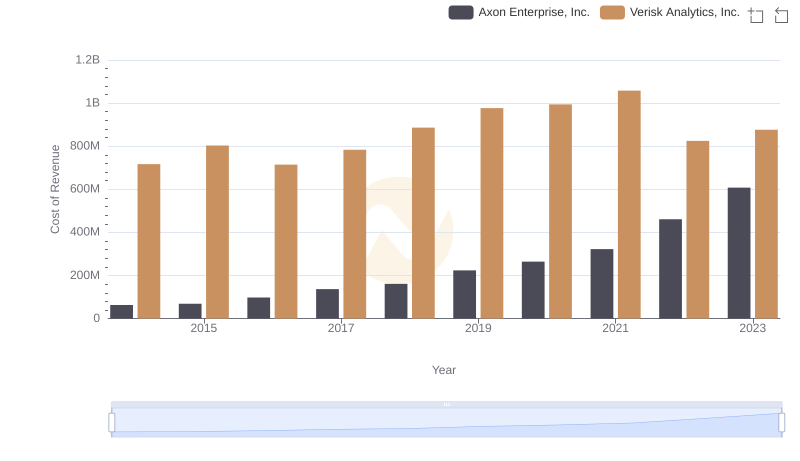
Comparing Cost of Revenue Efficiency: Axon Enterprise, Inc. vs Verisk Analytics, Inc.

Cost of Revenue Trends: Axon Enterprise, Inc. vs Ferguson plc
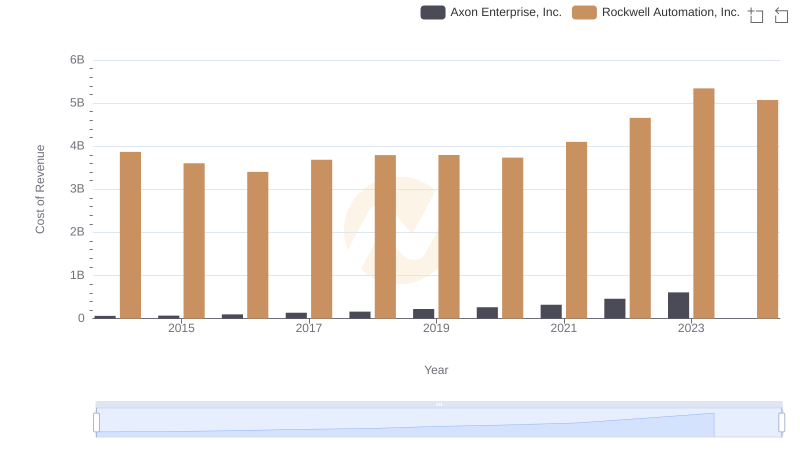
Cost of Revenue Comparison: Axon Enterprise, Inc. vs Rockwell Automation, Inc.
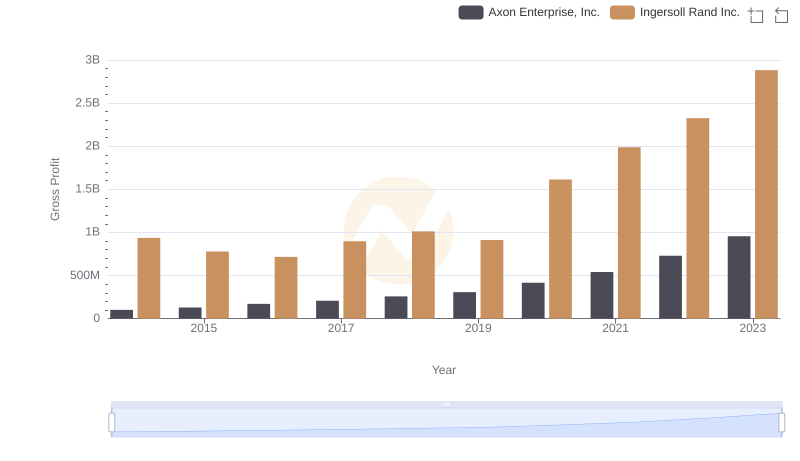
Axon Enterprise, Inc. and Ingersoll Rand Inc.: A Detailed Gross Profit Analysis
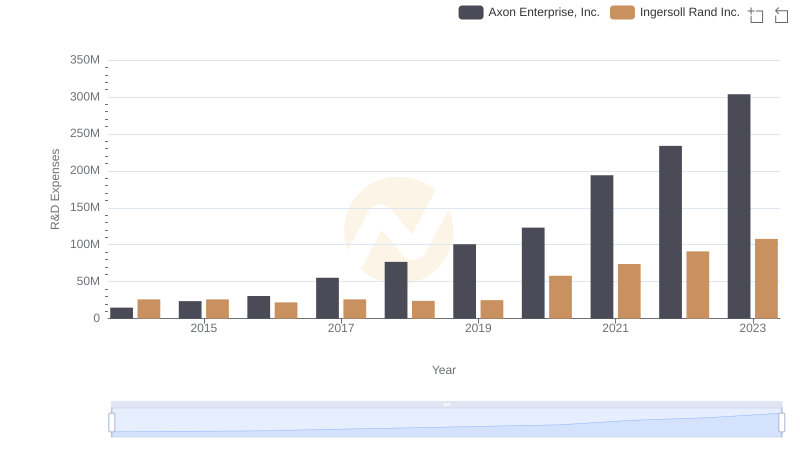
Research and Development Investment: Axon Enterprise, Inc. vs Ingersoll Rand Inc.