| __timestamp | Axon Enterprise, Inc. | L3Harris Technologies, Inc. |
|---|---|---|
| Wednesday, January 1, 2014 | 164525000 | 3885000000 |
| Thursday, January 1, 2015 | 197892000 | 5992000000 |
| Friday, January 1, 2016 | 268245000 | 5897000000 |
| Sunday, January 1, 2017 | 343798000 | 6168000000 |
| Monday, January 1, 2018 | 420068000 | 6801000000 |
| Tuesday, January 1, 2019 | 530860000 | 18526000000 |
| Wednesday, January 1, 2020 | 681003000 | 18194000000 |
| Friday, January 1, 2021 | 863381000 | 17814000000 |
| Saturday, January 1, 2022 | 1189935000 | 17062000000 |
| Sunday, January 1, 2023 | 1563391000 | 19419000000 |
| Monday, January 1, 2024 | 21325000000 |
Unlocking the unknown
In the ever-evolving landscape of technology and defense, Axon Enterprise, Inc. and L3Harris Technologies, Inc. have emerged as key players. Over the past decade, Axon has seen its revenue grow nearly tenfold, from approximately $165 million in 2014 to over $1.5 billion in 2023. This represents a staggering 847% increase, highlighting Axon's rapid expansion in the public safety sector.
Meanwhile, L3Harris, a giant in the defense industry, has maintained a robust revenue stream, with a 50% increase from $3.9 billion in 2014 to nearly $19.4 billion in 2023. This steady growth underscores its dominance and resilience in a competitive market.
While Axon's growth trajectory is impressive, L3Harris's consistent revenue underscores its established market position. This comparison offers a fascinating glimpse into the dynamics of innovation and stability within the tech and defense sectors.
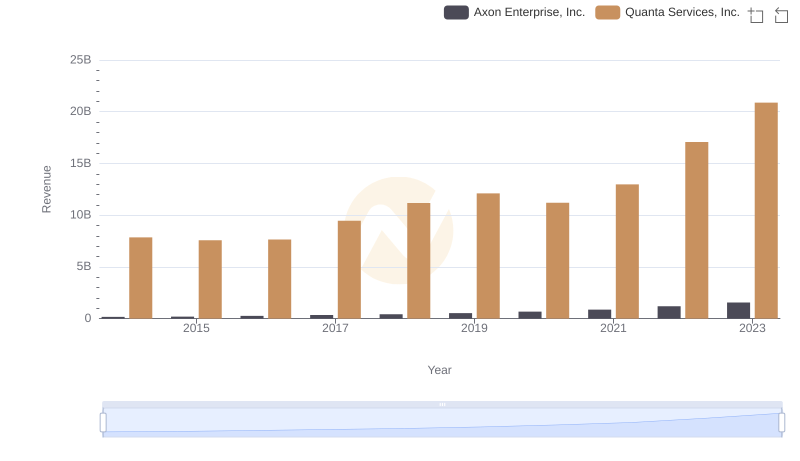
Breaking Down Revenue Trends: Axon Enterprise, Inc. vs Quanta Services, Inc.
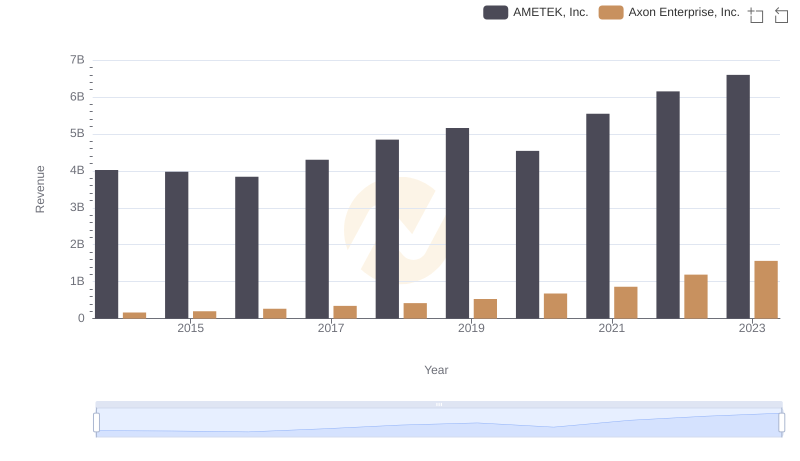
Annual Revenue Comparison: Axon Enterprise, Inc. vs AMETEK, Inc.
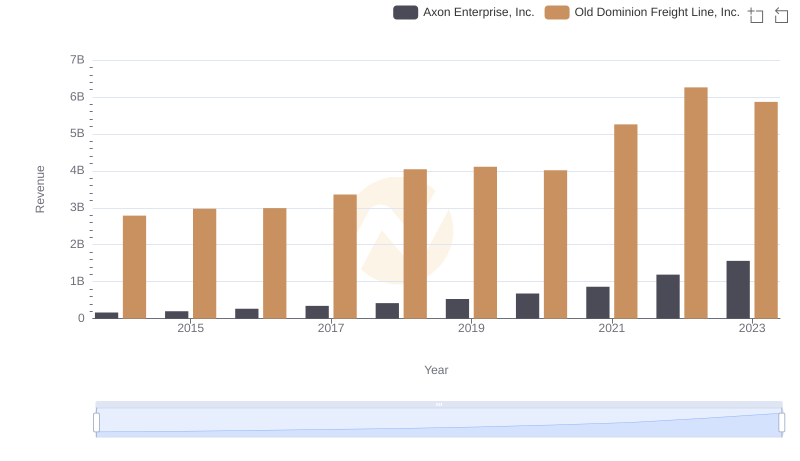
Comparing Revenue Performance: Axon Enterprise, Inc. or Old Dominion Freight Line, Inc.?
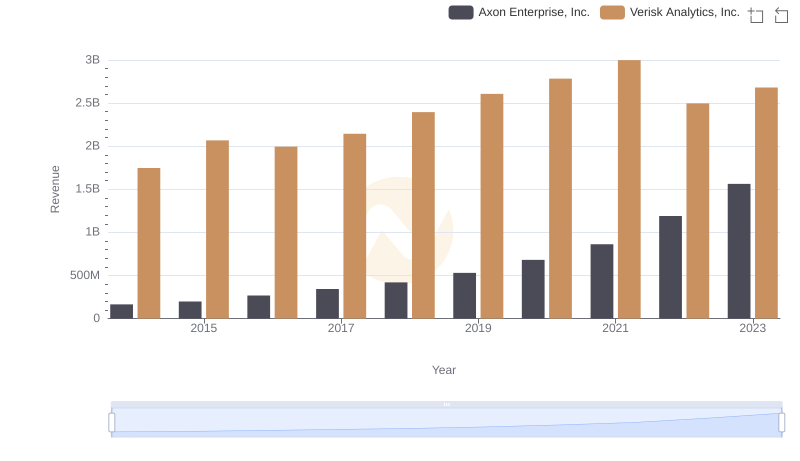
Axon Enterprise, Inc. or Verisk Analytics, Inc.: Who Leads in Yearly Revenue?
Axon Enterprise, Inc. vs Ingersoll Rand Inc.: Annual Revenue Growth Compared

Who Generates More Revenue? Axon Enterprise, Inc. or Ferguson plc
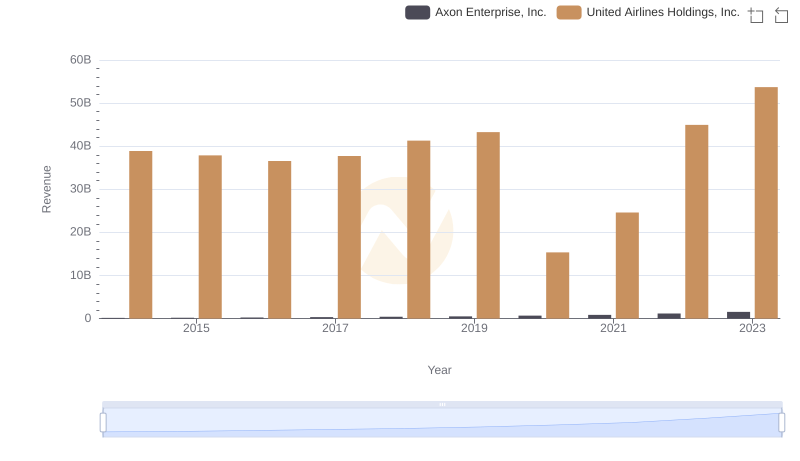
Annual Revenue Comparison: Axon Enterprise, Inc. vs United Airlines Holdings, Inc.
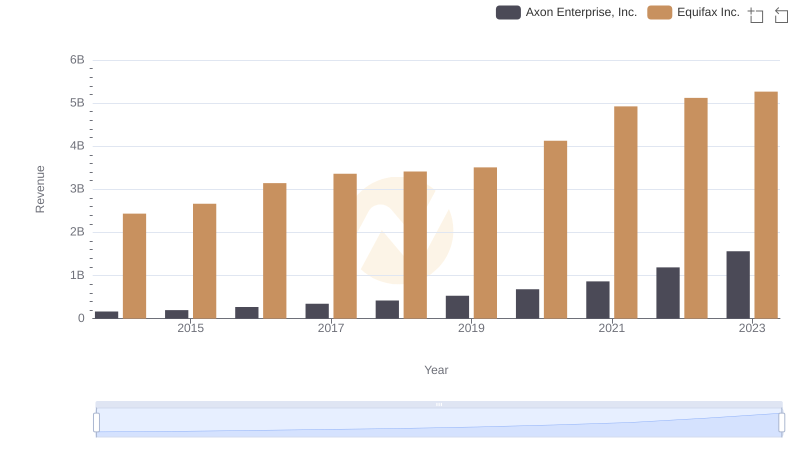
Annual Revenue Comparison: Axon Enterprise, Inc. vs Equifax Inc.
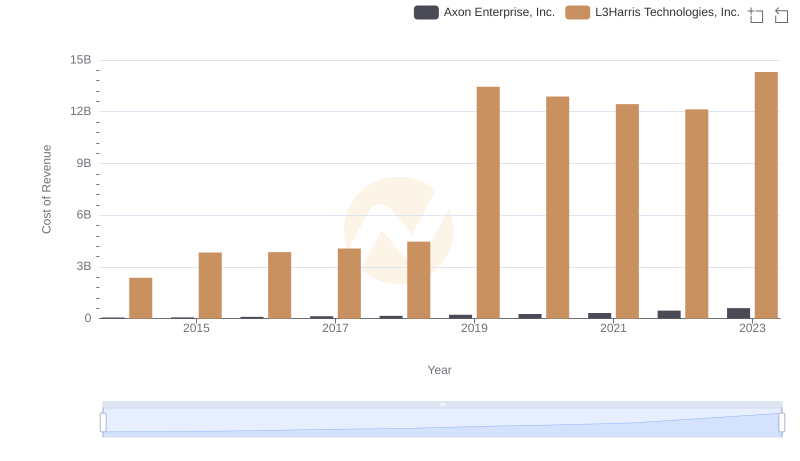
Axon Enterprise, Inc. vs L3Harris Technologies, Inc.: Efficiency in Cost of Revenue Explored
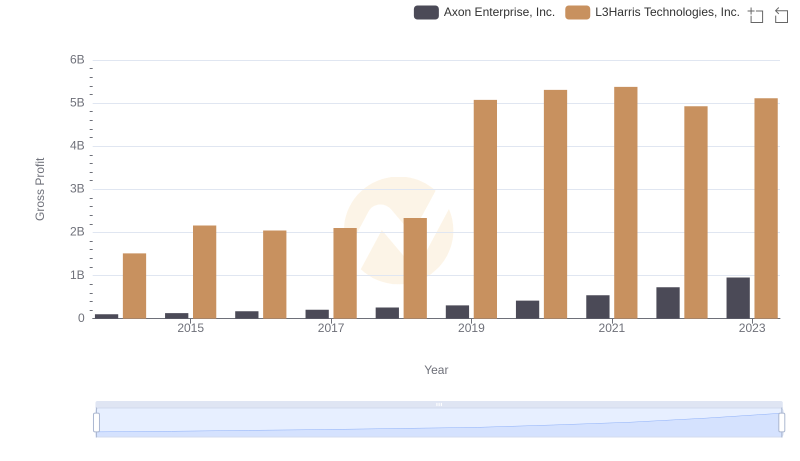
Axon Enterprise, Inc. vs L3Harris Technologies, Inc.: A Gross Profit Performance Breakdown
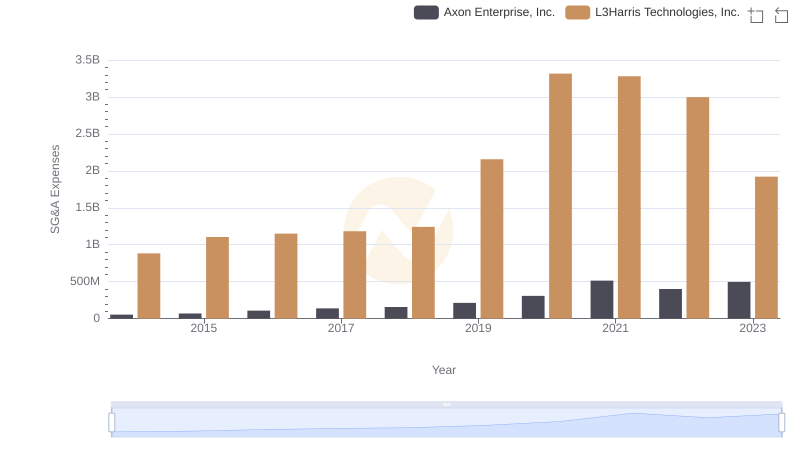
Selling, General, and Administrative Costs: Axon Enterprise, Inc. vs L3Harris Technologies, Inc.