| __timestamp | Axon Enterprise, Inc. | Fastenal Company |
|---|---|---|
| Wednesday, January 1, 2014 | 62977000 | 1836105000 |
| Thursday, January 1, 2015 | 69245000 | 1920253000 |
| Friday, January 1, 2016 | 97709000 | 1997259000 |
| Sunday, January 1, 2017 | 136710000 | 2226900000 |
| Monday, January 1, 2018 | 161485000 | 2566200000 |
| Tuesday, January 1, 2019 | 223574000 | 2818300000 |
| Wednesday, January 1, 2020 | 264672000 | 3079500000 |
| Friday, January 1, 2021 | 322471000 | 3233700000 |
| Saturday, January 1, 2022 | 461297000 | 3764800000 |
| Sunday, January 1, 2023 | 608009000 | 3992200000 |
| Monday, January 1, 2024 | 4144100000 |
Igniting the spark of knowledge
In the ever-evolving landscape of corporate finance, understanding cost structures is crucial for investors and analysts alike. This analysis delves into the cost of revenue trends for Axon Enterprise, Inc. and Fastenal Company from 2014 to 2023. Over this decade, Axon Enterprise, Inc. has seen a staggering increase in its cost of revenue, growing nearly tenfold from approximately $63 million in 2014 to over $608 million in 2023. This reflects a robust expansion strategy and increased operational scale. In contrast, Fastenal Company, a stalwart in the industrial supply sector, has maintained a more stable growth trajectory, with its cost of revenue rising by about 117% from $1.84 billion in 2014 to $3.99 billion in 2023. Notably, 2024 data for Axon is missing, indicating potential reporting delays or strategic shifts. These insights offer a window into the financial health and strategic priorities of these industry leaders.
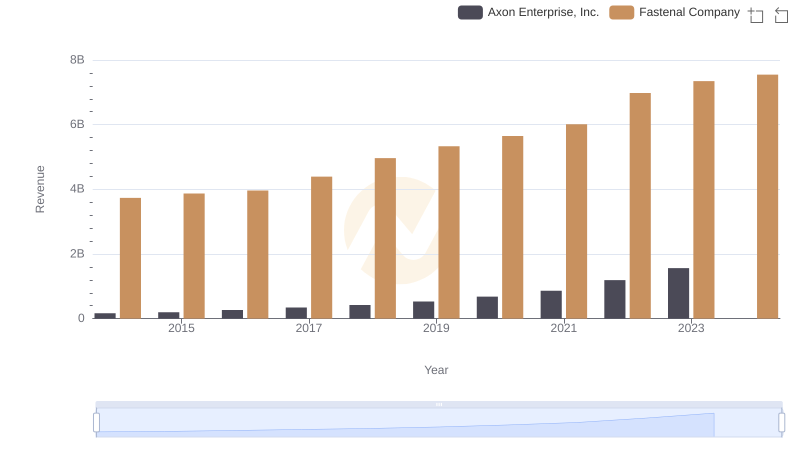
Comparing Revenue Performance: Axon Enterprise, Inc. or Fastenal Company?
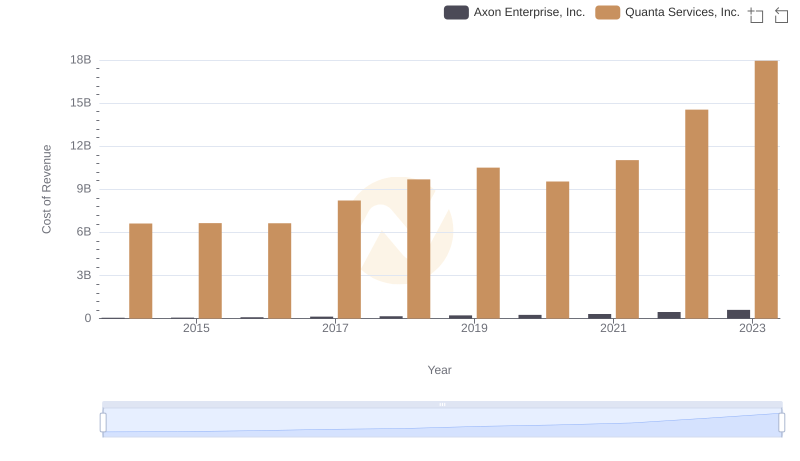
Axon Enterprise, Inc. vs Quanta Services, Inc.: Efficiency in Cost of Revenue Explored
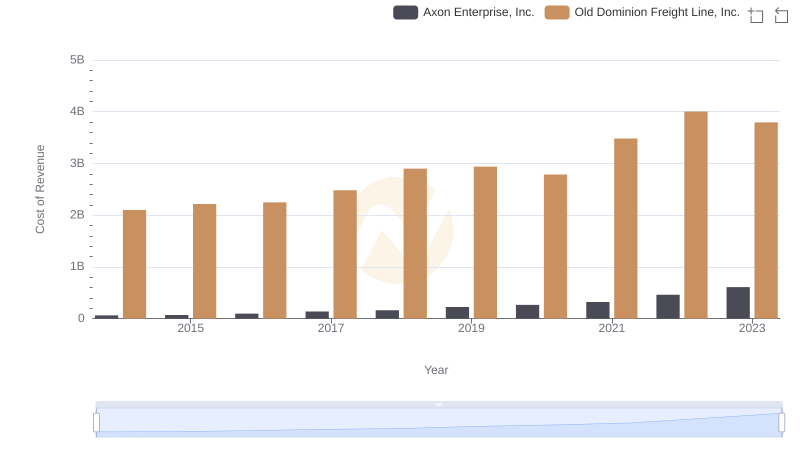
Cost of Revenue Trends: Axon Enterprise, Inc. vs Old Dominion Freight Line, Inc.
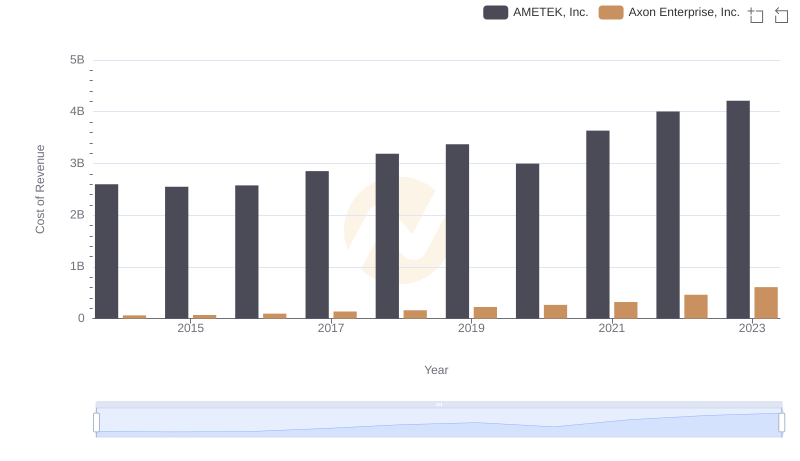
Cost of Revenue: Key Insights for Axon Enterprise, Inc. and AMETEK, Inc.
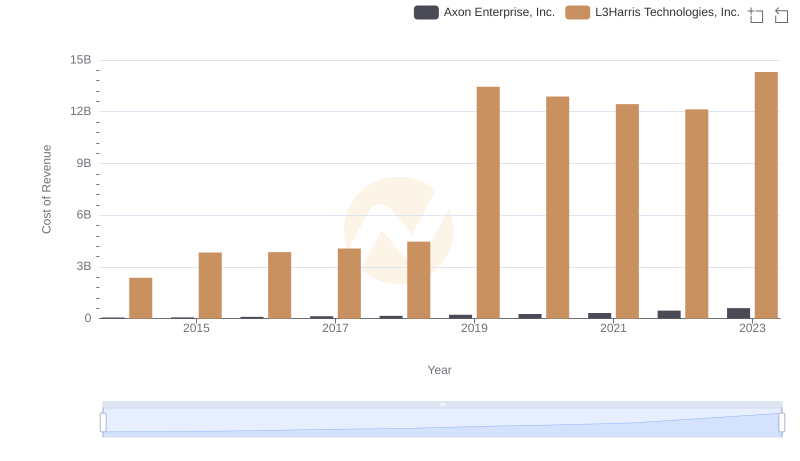
Axon Enterprise, Inc. vs L3Harris Technologies, Inc.: Efficiency in Cost of Revenue Explored
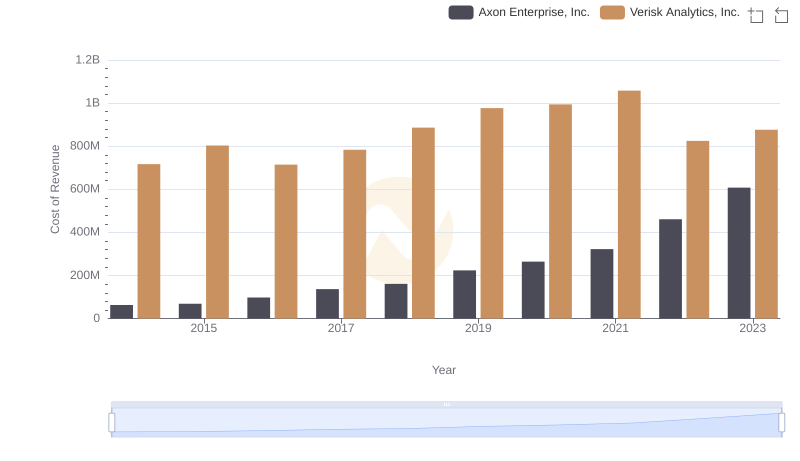
Comparing Cost of Revenue Efficiency: Axon Enterprise, Inc. vs Verisk Analytics, Inc.

Cost of Revenue Trends: Axon Enterprise, Inc. vs Ferguson plc
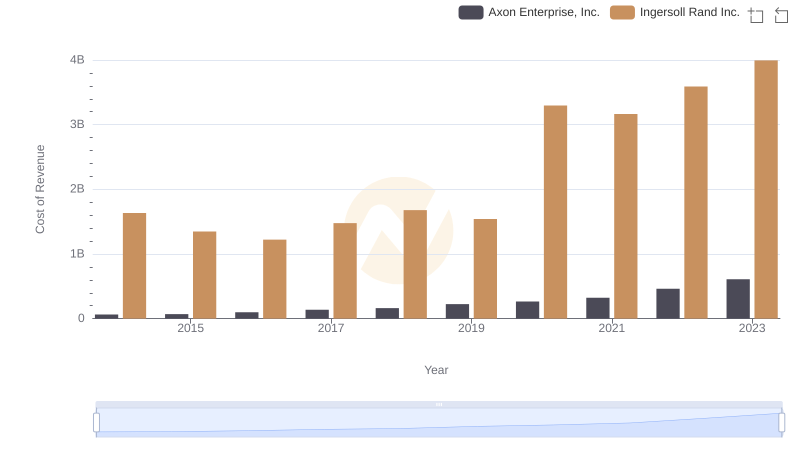
Analyzing Cost of Revenue: Axon Enterprise, Inc. and Ingersoll Rand Inc.
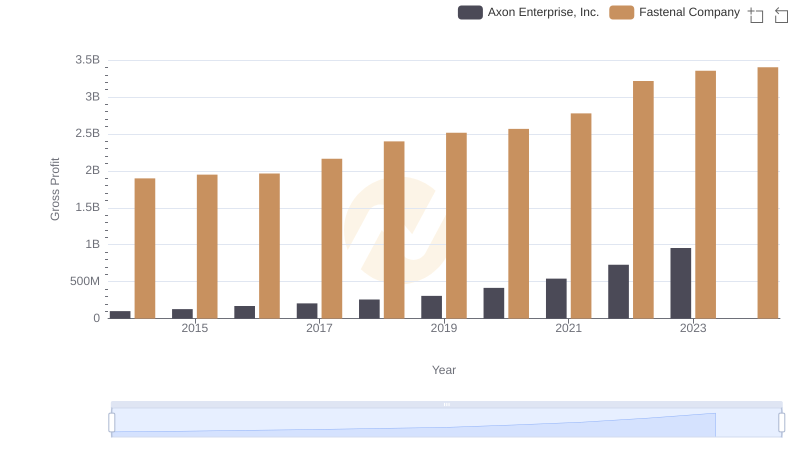
Axon Enterprise, Inc. and Fastenal Company: A Detailed Gross Profit Analysis