| __timestamp | AMETEK, Inc. | Axon Enterprise, Inc. |
|---|---|---|
| Wednesday, January 1, 2014 | 2597017000 | 62977000 |
| Thursday, January 1, 2015 | 2549280000 | 69245000 |
| Friday, January 1, 2016 | 2575220000 | 97709000 |
| Sunday, January 1, 2017 | 2851431000 | 136710000 |
| Monday, January 1, 2018 | 3186310000 | 161485000 |
| Tuesday, January 1, 2019 | 3370897000 | 223574000 |
| Wednesday, January 1, 2020 | 2996515000 | 264672000 |
| Friday, January 1, 2021 | 3633900000 | 322471000 |
| Saturday, January 1, 2022 | 4005261000 | 461297000 |
| Sunday, January 1, 2023 | 4212484999 | 608009000 |
| Monday, January 1, 2024 | 0 |
Unleashing the power of data
In the ever-evolving landscape of American industry, understanding the cost of revenue is crucial for evaluating a company's financial health. Over the past decade, AMETEK, Inc. and Axon Enterprise, Inc. have shown distinct trajectories in their cost of revenue, reflecting their unique market strategies and growth patterns.
From 2014 to 2023, AMETEK's cost of revenue has seen a steady increase, peaking at over $4 billion in 2023. This represents a growth of approximately 62% from its 2014 figures, highlighting AMETEK's robust expansion and operational efficiency.
Conversely, Axon Enterprise, Inc. has experienced a more dramatic rise, with its cost of revenue surging nearly tenfold from 2014 to 2023. This rapid increase underscores Axon's aggressive growth strategy and its commitment to scaling operations.
These insights provide a window into the strategic priorities of these two industry leaders, offering valuable lessons for investors and analysts alike.
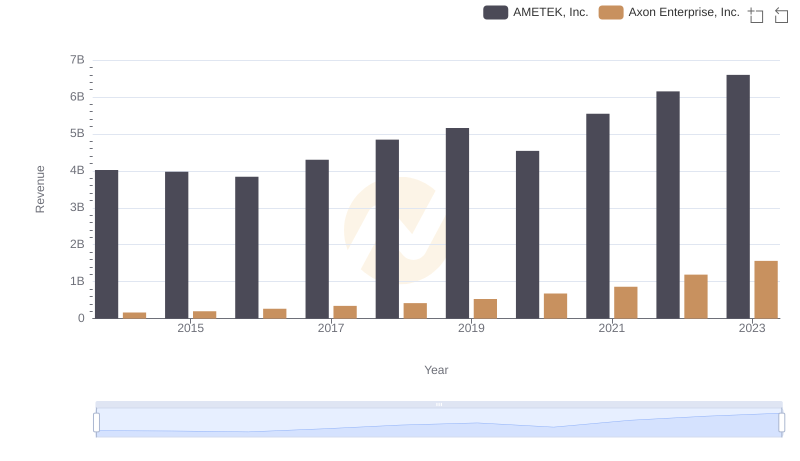
Annual Revenue Comparison: Axon Enterprise, Inc. vs AMETEK, Inc.

Cost Insights: Breaking Down Axon Enterprise, Inc. and Fastenal Company's Expenses
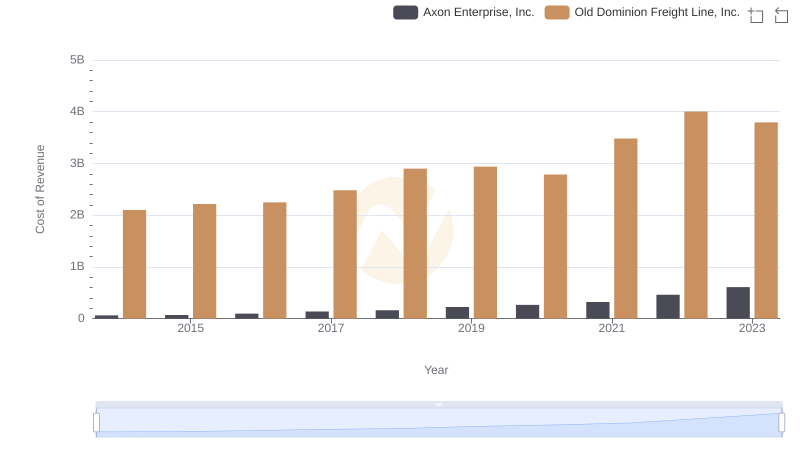
Cost of Revenue Trends: Axon Enterprise, Inc. vs Old Dominion Freight Line, Inc.
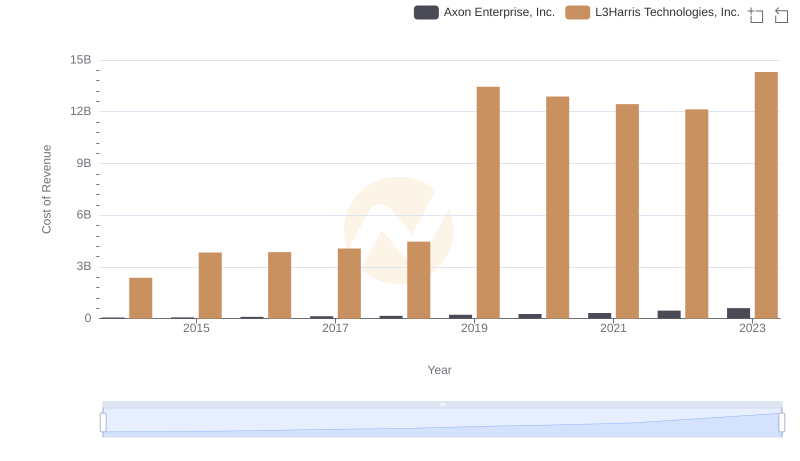
Axon Enterprise, Inc. vs L3Harris Technologies, Inc.: Efficiency in Cost of Revenue Explored
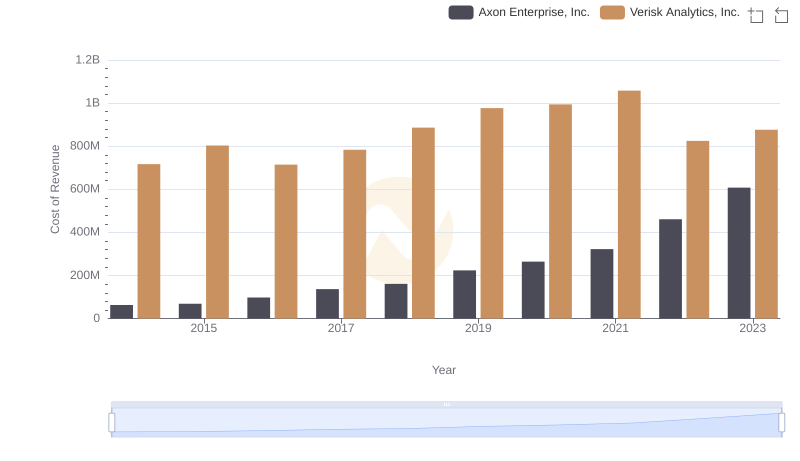
Comparing Cost of Revenue Efficiency: Axon Enterprise, Inc. vs Verisk Analytics, Inc.

Cost of Revenue Trends: Axon Enterprise, Inc. vs Ferguson plc
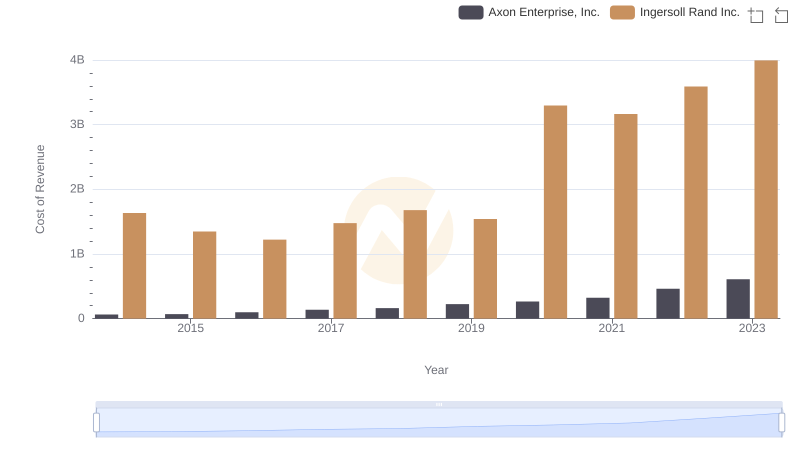
Analyzing Cost of Revenue: Axon Enterprise, Inc. and Ingersoll Rand Inc.
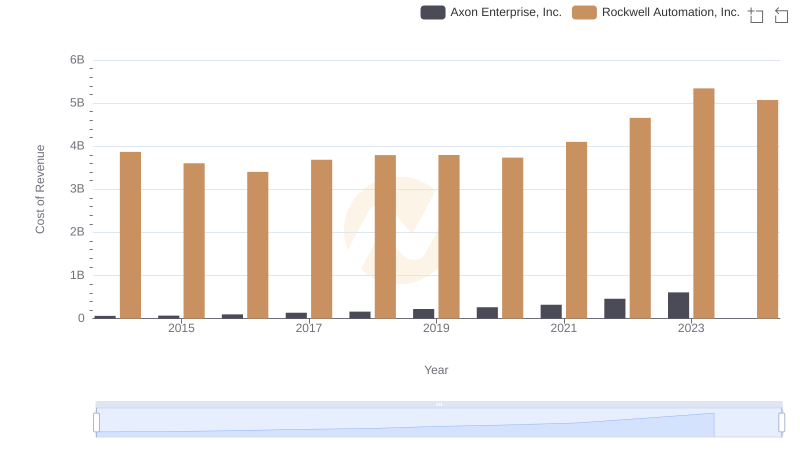
Cost of Revenue Comparison: Axon Enterprise, Inc. vs Rockwell Automation, Inc.

Gross Profit Trends Compared: Axon Enterprise, Inc. vs AMETEK, Inc.
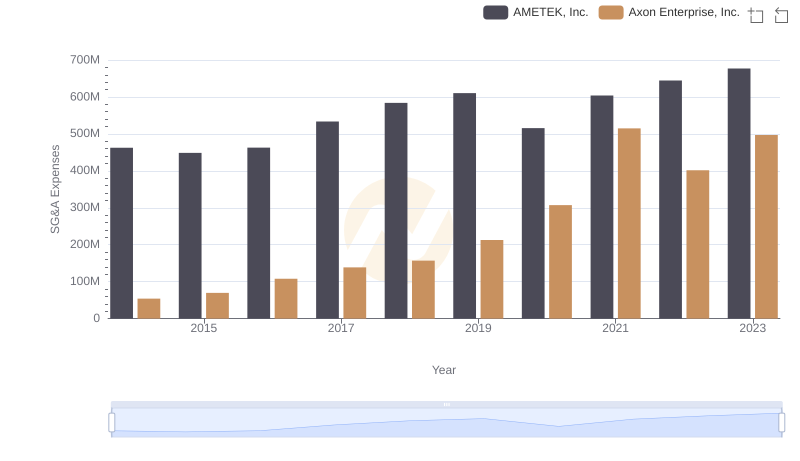
SG&A Efficiency Analysis: Comparing Axon Enterprise, Inc. and AMETEK, Inc.