| __timestamp | Axon Enterprise, Inc. | Rockwell Automation, Inc. |
|---|---|---|
| Wednesday, January 1, 2014 | 62977000 | 3869600000 |
| Thursday, January 1, 2015 | 69245000 | 3604800000 |
| Friday, January 1, 2016 | 97709000 | 3404000000 |
| Sunday, January 1, 2017 | 136710000 | 3687100000 |
| Monday, January 1, 2018 | 161485000 | 3793800000 |
| Tuesday, January 1, 2019 | 223574000 | 3794700000 |
| Wednesday, January 1, 2020 | 264672000 | 3734600000 |
| Friday, January 1, 2021 | 322471000 | 4099700000 |
| Saturday, January 1, 2022 | 461297000 | 4658400000 |
| Sunday, January 1, 2023 | 608009000 | 5341000000 |
| Monday, January 1, 2024 | 5070800000 |
Unveiling the hidden dimensions of data
In the ever-evolving landscape of industrial technology, Axon Enterprise, Inc. and Rockwell Automation, Inc. stand as titans. Over the past decade, these companies have showcased contrasting trajectories in their cost of revenue. From 2014 to 2023, Axon Enterprise's cost of revenue surged by nearly 900%, reflecting its aggressive growth strategy and expanding market presence. In contrast, Rockwell Automation, a stalwart in industrial automation, experienced a more modest increase of around 38% during the same period.
This divergence highlights the dynamic nature of the industry, where innovation and scale play pivotal roles. While Axon's rapid ascent underscores its adaptability and market penetration, Rockwell's steady growth emphasizes its established dominance and resilience. As we look to the future, the missing data for 2024 leaves room for speculation, inviting investors and analysts alike to ponder the next chapter in this compelling narrative.
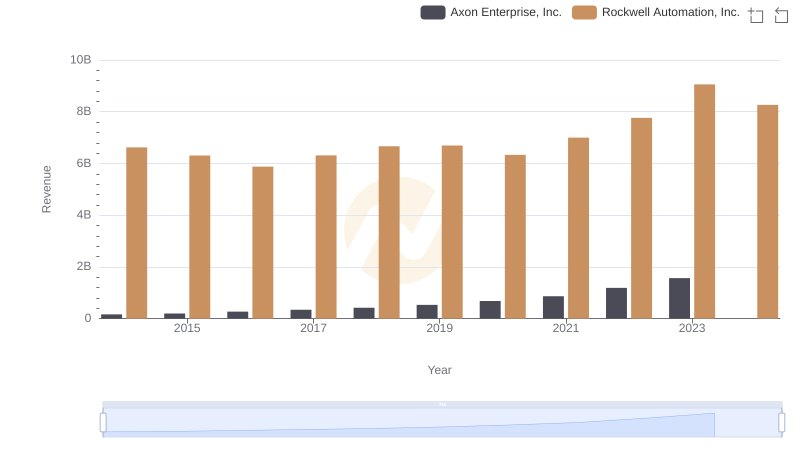
Axon Enterprise, Inc. vs Rockwell Automation, Inc.: Annual Revenue Growth Compared
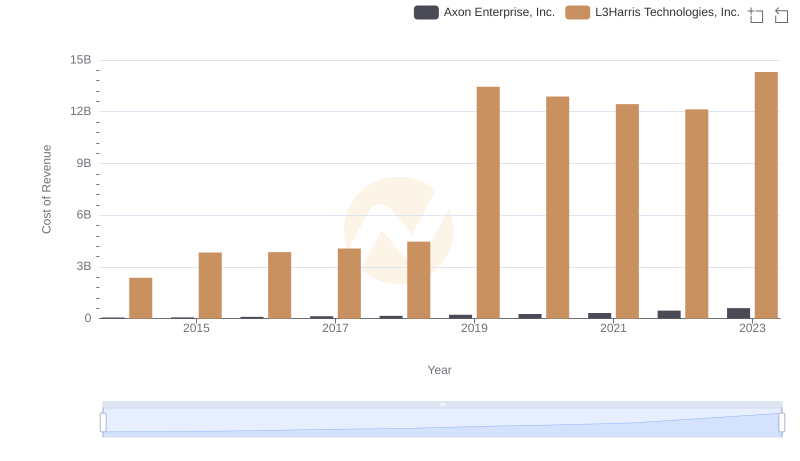
Axon Enterprise, Inc. vs L3Harris Technologies, Inc.: Efficiency in Cost of Revenue Explored
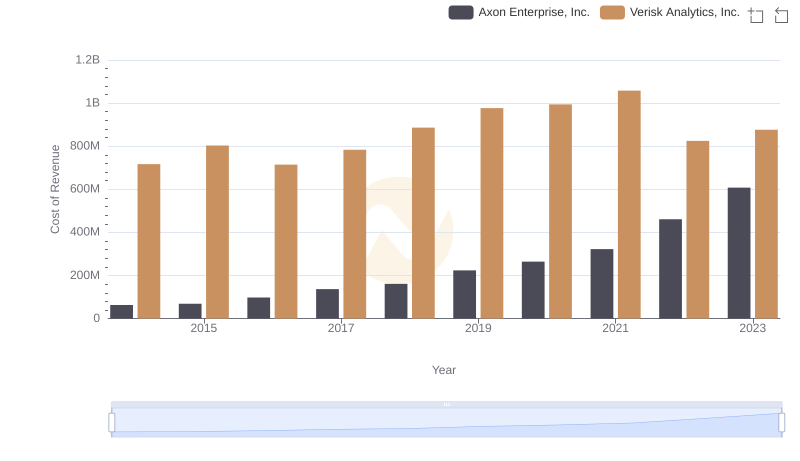
Comparing Cost of Revenue Efficiency: Axon Enterprise, Inc. vs Verisk Analytics, Inc.

Cost of Revenue Trends: Axon Enterprise, Inc. vs Ferguson plc
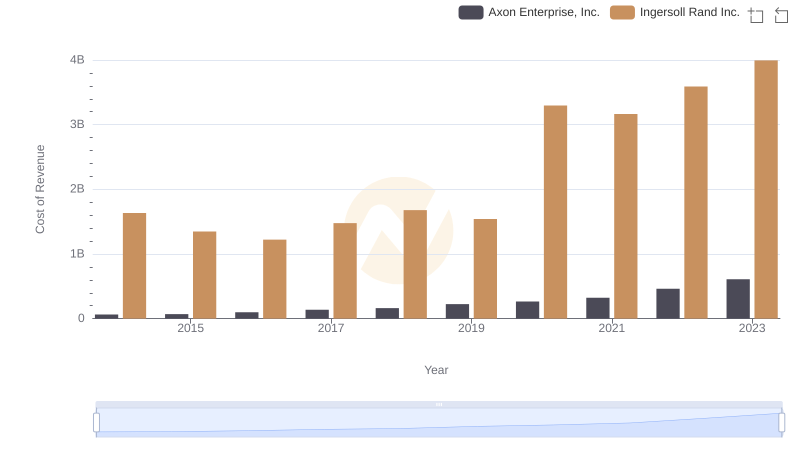
Analyzing Cost of Revenue: Axon Enterprise, Inc. and Ingersoll Rand Inc.
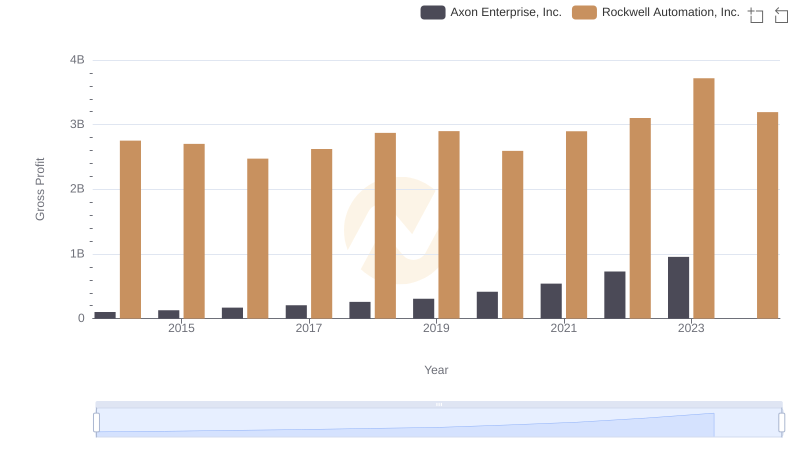
Axon Enterprise, Inc. and Rockwell Automation, Inc.: A Detailed Gross Profit Analysis
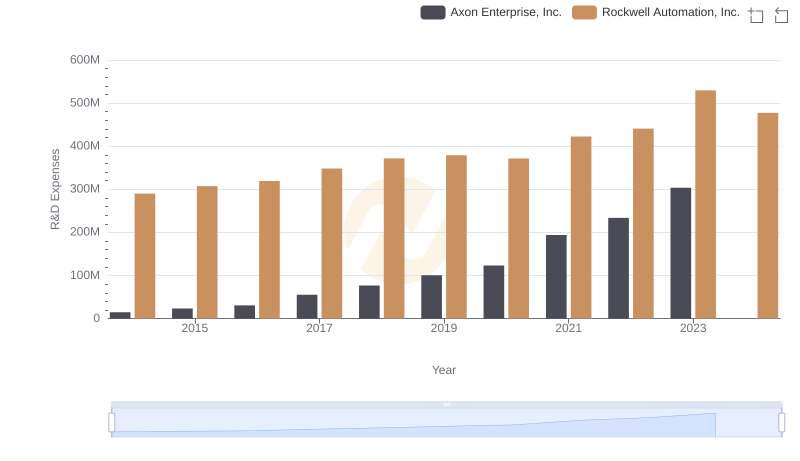
Research and Development: Comparing Key Metrics for Axon Enterprise, Inc. and Rockwell Automation, Inc.
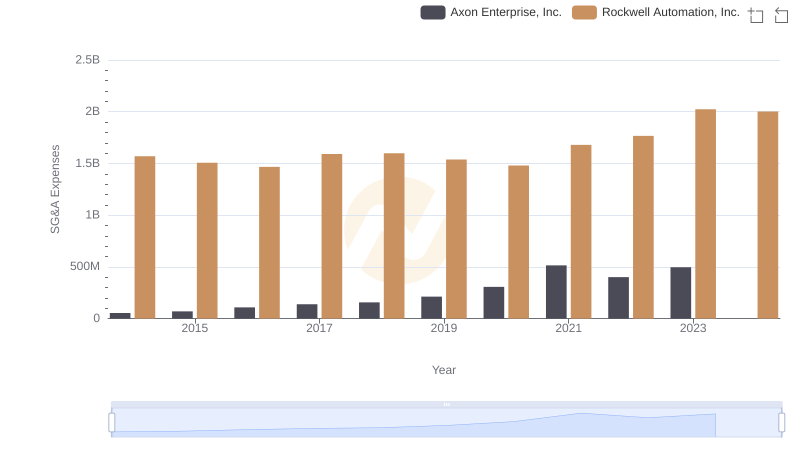
Operational Costs Compared: SG&A Analysis of Axon Enterprise, Inc. and Rockwell Automation, Inc.