| __timestamp | Axon Enterprise, Inc. | Ferguson plc |
|---|---|---|
| Wednesday, January 1, 2014 | 62977000 | 15995739428 |
| Thursday, January 1, 2015 | 69245000 | 14984241894 |
| Friday, January 1, 2016 | 97709000 | 13677144858 |
| Sunday, January 1, 2017 | 136710000 | 14215866673 |
| Monday, January 1, 2018 | 161485000 | 14708000000 |
| Tuesday, January 1, 2019 | 223574000 | 15552000000 |
| Wednesday, January 1, 2020 | 264672000 | 15398000000 |
| Friday, January 1, 2021 | 322471000 | 15812000000 |
| Saturday, January 1, 2022 | 461297000 | 19810000000 |
| Sunday, January 1, 2023 | 608009000 | 20709000000 |
| Monday, January 1, 2024 | 20582000000 |
Unleashing insights
In the ever-evolving landscape of global business, understanding cost structures is crucial. This analysis delves into the cost of revenue trends for two industry giants: Axon Enterprise, Inc. and Ferguson plc, from 2014 to 2023.
Axon Enterprise, Inc., a leader in public safety technology, has seen its cost of revenue grow by nearly 866% over the past decade, reflecting its aggressive expansion and innovation strategies. In contrast, Ferguson plc, a major player in the plumbing and heating sector, has maintained a relatively stable cost structure, with a modest increase of around 29% over the same period.
The data reveals a fascinating divergence in business models: Axon's rapid growth trajectory versus Ferguson's steady, resilient approach. Notably, 2024 data for Axon is missing, highlighting the need for continuous data monitoring to capture the full picture.

Who Generates More Revenue? Axon Enterprise, Inc. or Ferguson plc
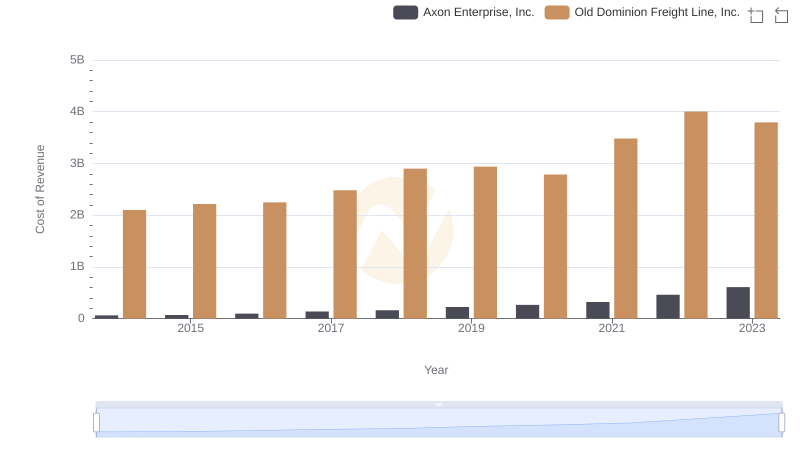
Cost of Revenue Trends: Axon Enterprise, Inc. vs Old Dominion Freight Line, Inc.
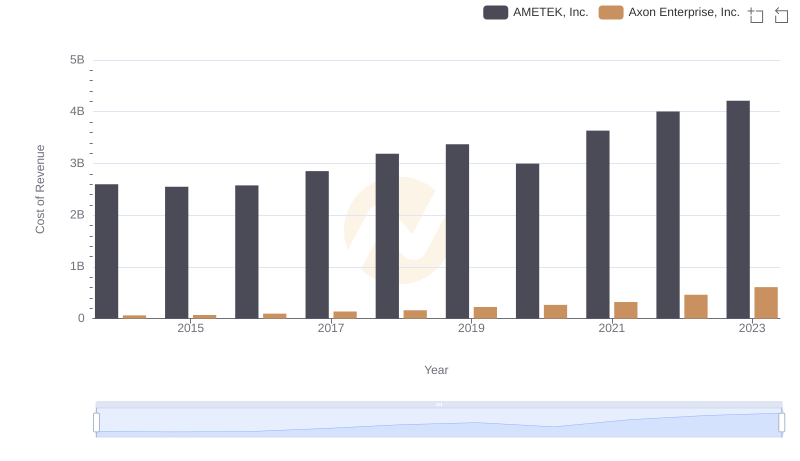
Cost of Revenue: Key Insights for Axon Enterprise, Inc. and AMETEK, Inc.
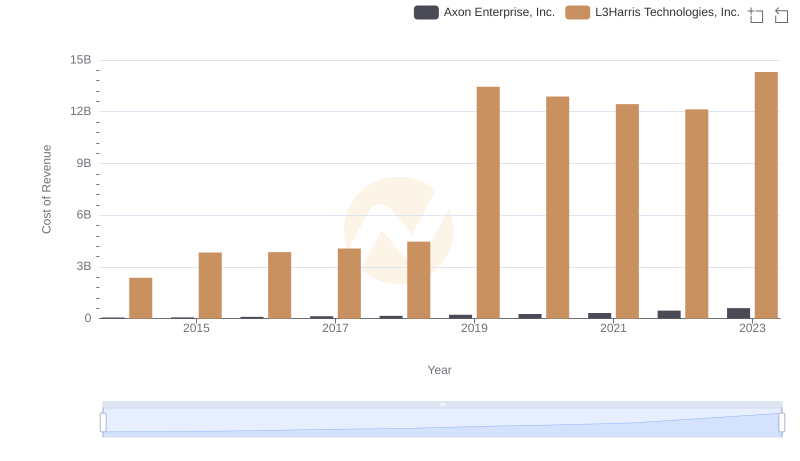
Axon Enterprise, Inc. vs L3Harris Technologies, Inc.: Efficiency in Cost of Revenue Explored
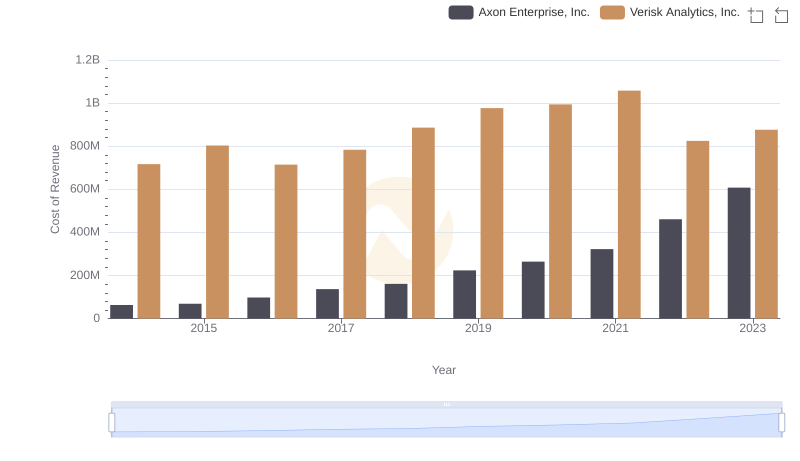
Comparing Cost of Revenue Efficiency: Axon Enterprise, Inc. vs Verisk Analytics, Inc.
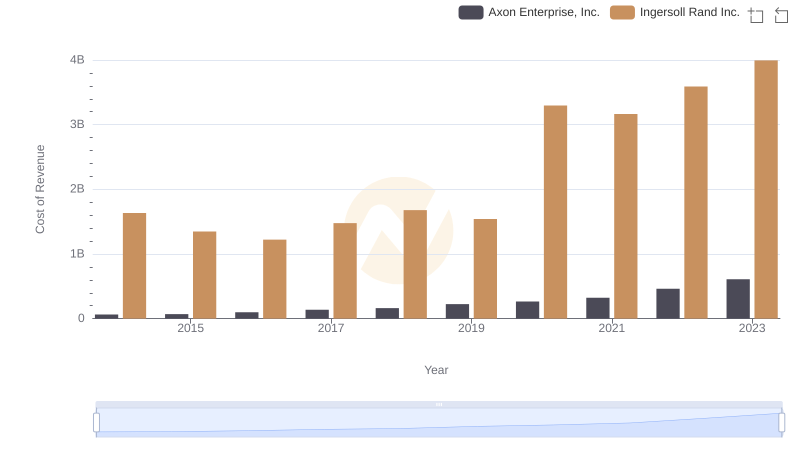
Analyzing Cost of Revenue: Axon Enterprise, Inc. and Ingersoll Rand Inc.
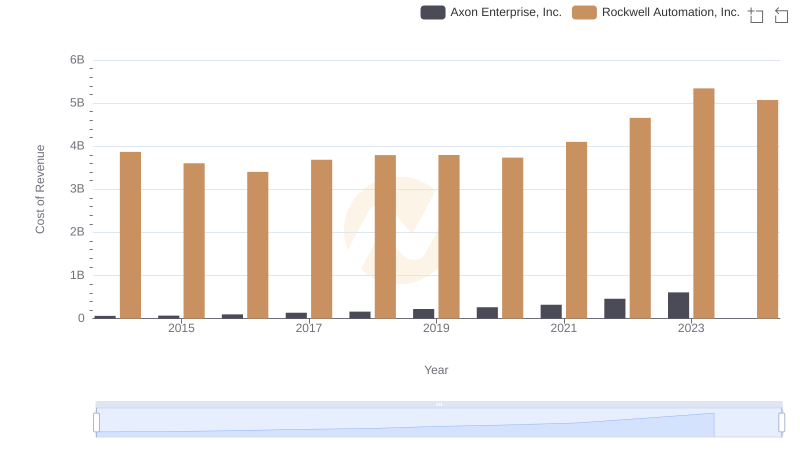
Cost of Revenue Comparison: Axon Enterprise, Inc. vs Rockwell Automation, Inc.

Key Insights on Gross Profit: Axon Enterprise, Inc. vs Ferguson plc
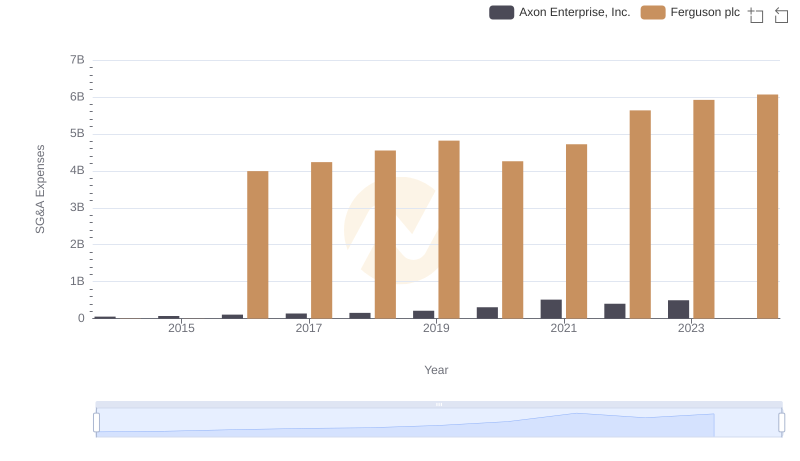
Axon Enterprise, Inc. or Ferguson plc: Who Manages SG&A Costs Better?