| __timestamp | Axon Enterprise, Inc. | L3Harris Technologies, Inc. |
|---|---|---|
| Wednesday, January 1, 2014 | 101548000 | 1515000000 |
| Thursday, January 1, 2015 | 128647000 | 2160000000 |
| Friday, January 1, 2016 | 170536000 | 2043000000 |
| Sunday, January 1, 2017 | 207088000 | 2102000000 |
| Monday, January 1, 2018 | 258583000 | 2334000000 |
| Tuesday, January 1, 2019 | 307286000 | 5074000000 |
| Wednesday, January 1, 2020 | 416331000 | 5308000000 |
| Friday, January 1, 2021 | 540910000 | 5376000000 |
| Saturday, January 1, 2022 | 728638000 | 4927000000 |
| Sunday, January 1, 2023 | 955382000 | 5113000000 |
| Monday, January 1, 2024 | 5524000000 |
Unveiling the hidden dimensions of data
In the competitive landscape of the defense and technology sectors, Axon Enterprise, Inc. and L3Harris Technologies, Inc. have demonstrated remarkable growth in gross profit over the past decade. From 2014 to 2023, Axon Enterprise, Inc. has seen its gross profit skyrocket by over 840%, starting from a modest $101 million to an impressive $955 million. Meanwhile, L3Harris Technologies, Inc. has maintained a robust performance, with gross profits consistently exceeding $1.5 billion, peaking at $5.38 billion in 2021.
This period marks a significant transformation for both companies, with Axon Enterprise, Inc. showing a consistent upward trend, reflecting its strategic expansion and innovation in public safety technologies. L3Harris Technologies, Inc., a stalwart in the defense industry, has leveraged its extensive portfolio to sustain its market dominance. This analysis underscores the dynamic shifts and strategic maneuvers that define the financial trajectories of these industry leaders.
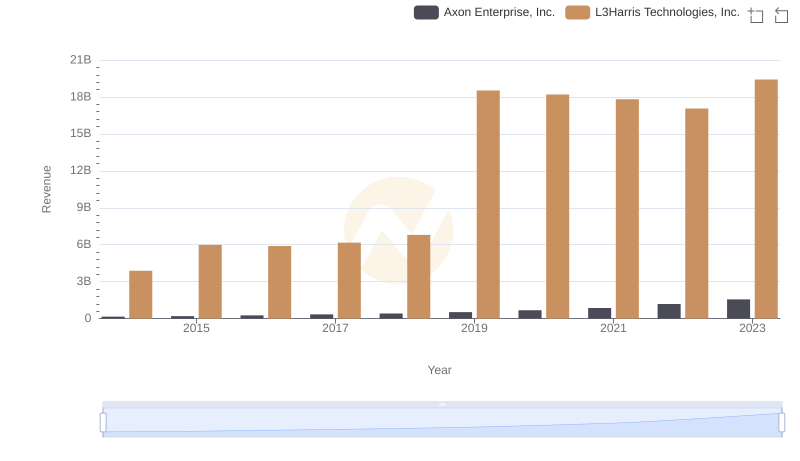
Annual Revenue Comparison: Axon Enterprise, Inc. vs L3Harris Technologies, Inc.
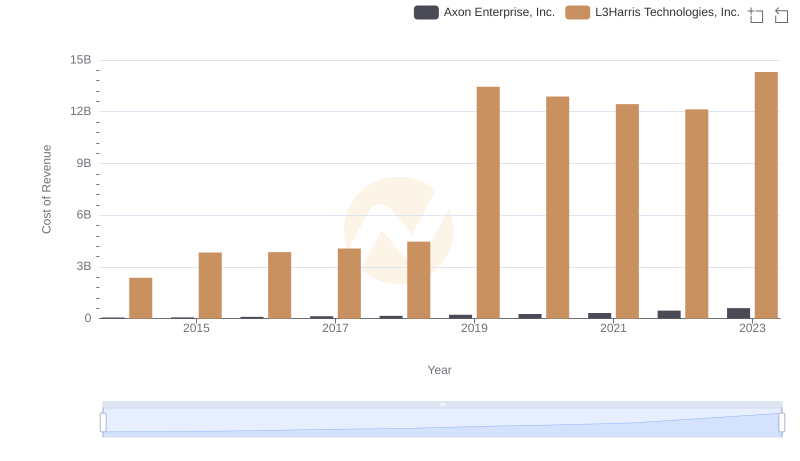
Axon Enterprise, Inc. vs L3Harris Technologies, Inc.: Efficiency in Cost of Revenue Explored
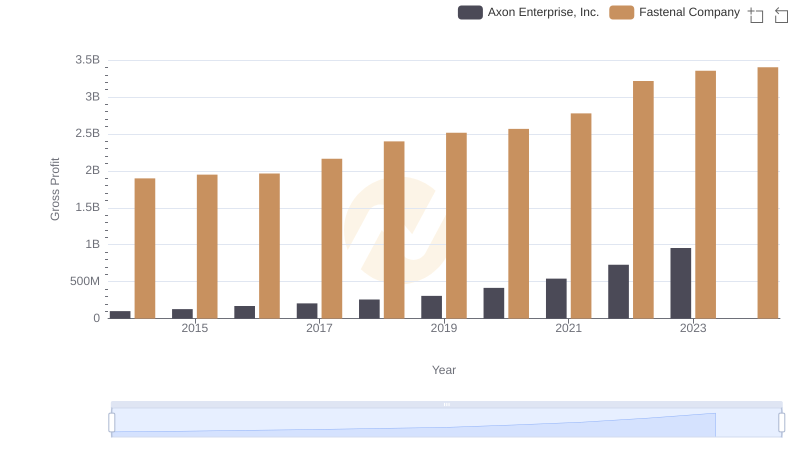
Axon Enterprise, Inc. and Fastenal Company: A Detailed Gross Profit Analysis
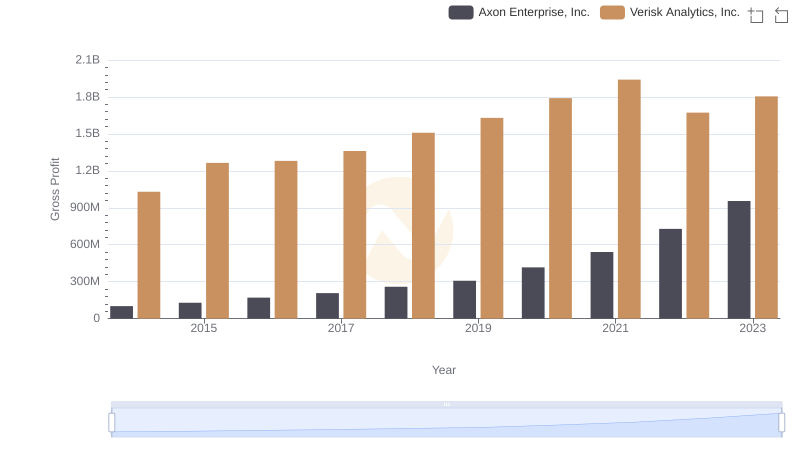
Gross Profit Trends Compared: Axon Enterprise, Inc. vs Verisk Analytics, Inc.
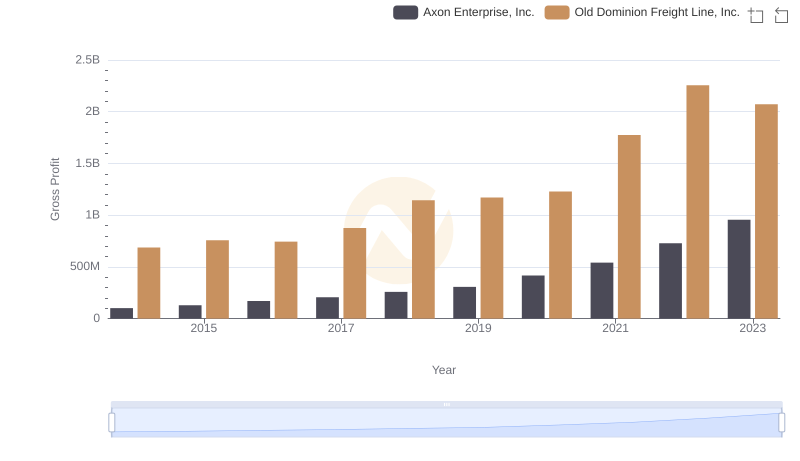
Axon Enterprise, Inc. vs Old Dominion Freight Line, Inc.: A Gross Profit Performance Breakdown

Gross Profit Trends Compared: Axon Enterprise, Inc. vs AMETEK, Inc.

Key Insights on Gross Profit: Axon Enterprise, Inc. vs Ferguson plc
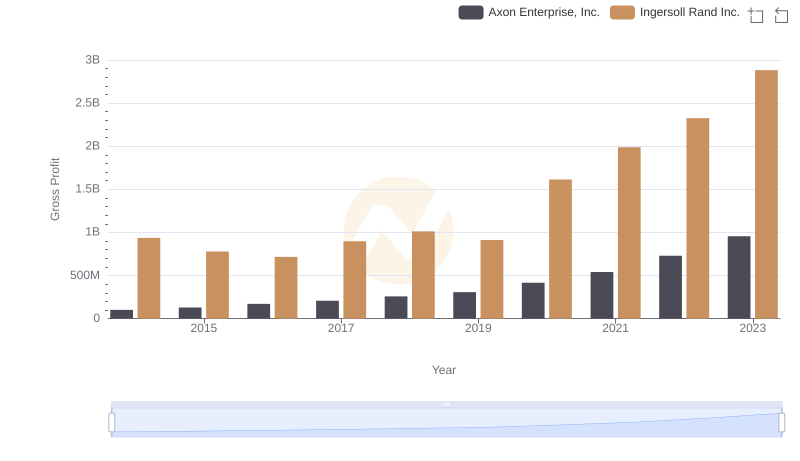
Axon Enterprise, Inc. and Ingersoll Rand Inc.: A Detailed Gross Profit Analysis
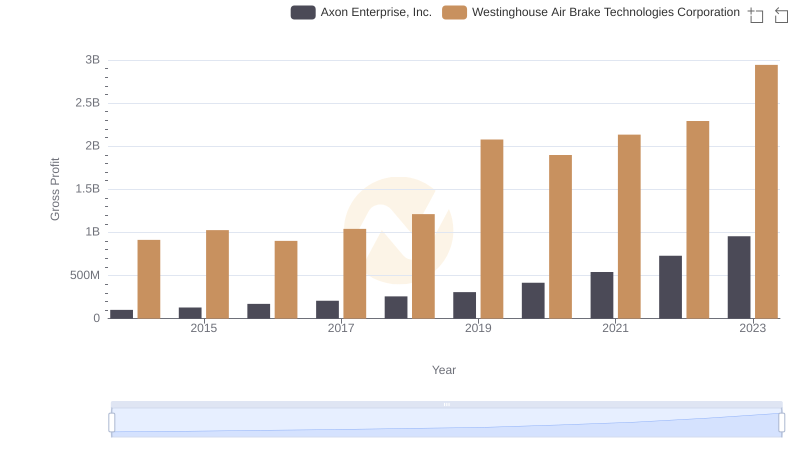
Key Insights on Gross Profit: Axon Enterprise, Inc. vs Westinghouse Air Brake Technologies Corporation
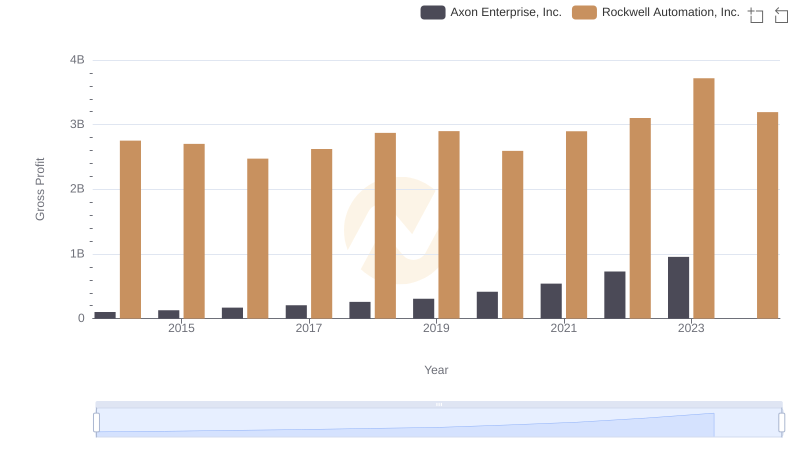
Axon Enterprise, Inc. and Rockwell Automation, Inc.: A Detailed Gross Profit Analysis
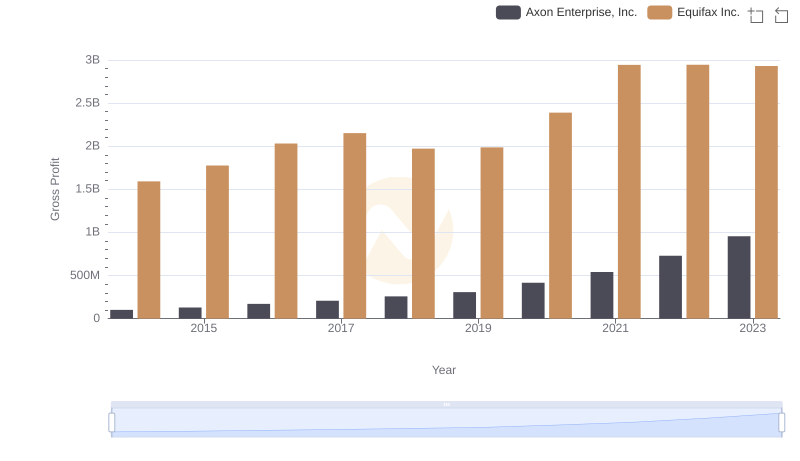
Who Generates Higher Gross Profit? Axon Enterprise, Inc. or Equifax Inc.
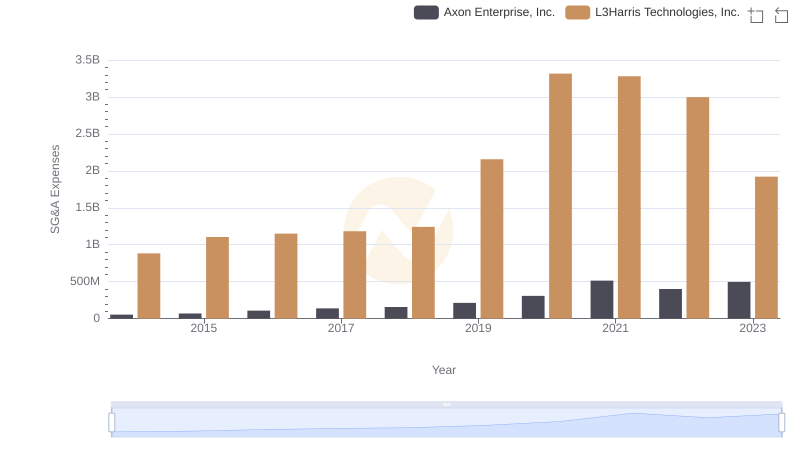
Selling, General, and Administrative Costs: Axon Enterprise, Inc. vs L3Harris Technologies, Inc.