| __timestamp | Axon Enterprise, Inc. | Verisk Analytics, Inc. |
|---|---|---|
| Wednesday, January 1, 2014 | 62977000 | 716598000 |
| Thursday, January 1, 2015 | 69245000 | 803274000 |
| Friday, January 1, 2016 | 97709000 | 714400000 |
| Sunday, January 1, 2017 | 136710000 | 783800000 |
| Monday, January 1, 2018 | 161485000 | 886200000 |
| Tuesday, January 1, 2019 | 223574000 | 976800000 |
| Wednesday, January 1, 2020 | 264672000 | 993900000 |
| Friday, January 1, 2021 | 322471000 | 1057800000 |
| Saturday, January 1, 2022 | 461297000 | 824600000 |
| Sunday, January 1, 2023 | 608009000 | 876500000 |
Unlocking the unknown
In the ever-evolving landscape of corporate finance, understanding cost efficiency is paramount. Axon Enterprise, Inc. and Verisk Analytics, Inc. offer a compelling narrative of contrasting strategies over the past decade. From 2014 to 2023, Axon Enterprise, Inc. has seen its cost of revenue grow by nearly 866%, reflecting a strategic expansion and investment in operational capabilities. In contrast, Verisk Analytics, Inc. has maintained a more stable trajectory, with a modest increase of around 22% in the same period.
Axon's aggressive growth strategy is evident, with its cost of revenue peaking at approximately $608 million in 2023, up from $63 million in 2014. Meanwhile, Verisk's cost of revenue, although higher in absolute terms, has shown a steadier climb, reaching about $876 million in 2023. This comparison highlights the diverse approaches companies take in managing their operational costs, offering valuable insights for investors and analysts alike.
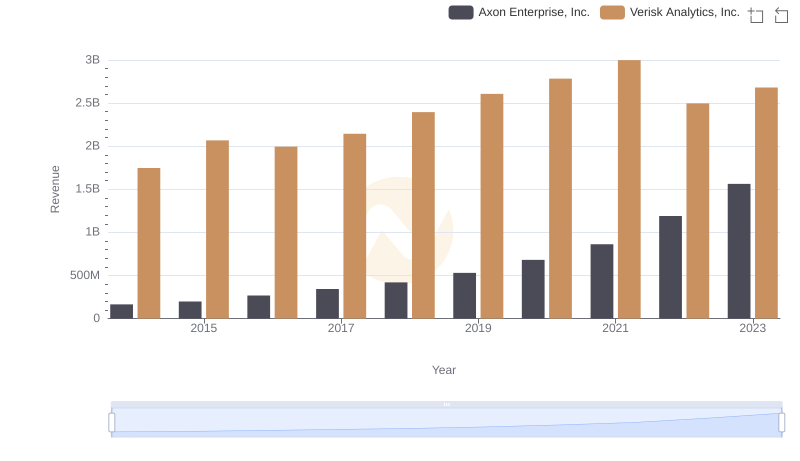
Axon Enterprise, Inc. or Verisk Analytics, Inc.: Who Leads in Yearly Revenue?

Cost Insights: Breaking Down Axon Enterprise, Inc. and Fastenal Company's Expenses
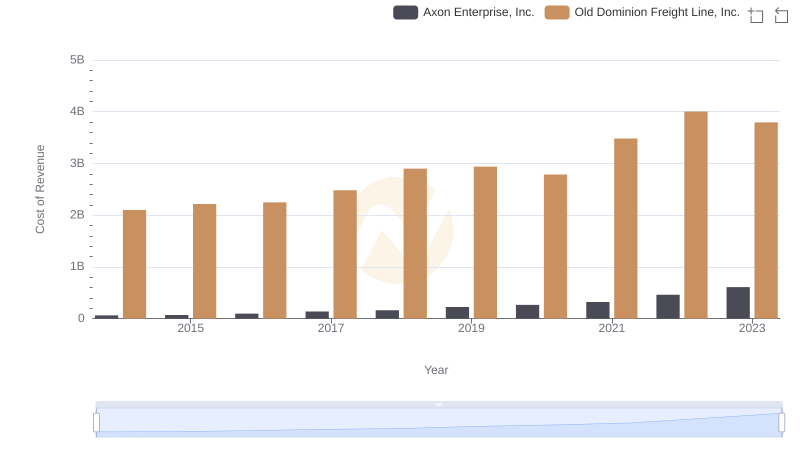
Cost of Revenue Trends: Axon Enterprise, Inc. vs Old Dominion Freight Line, Inc.
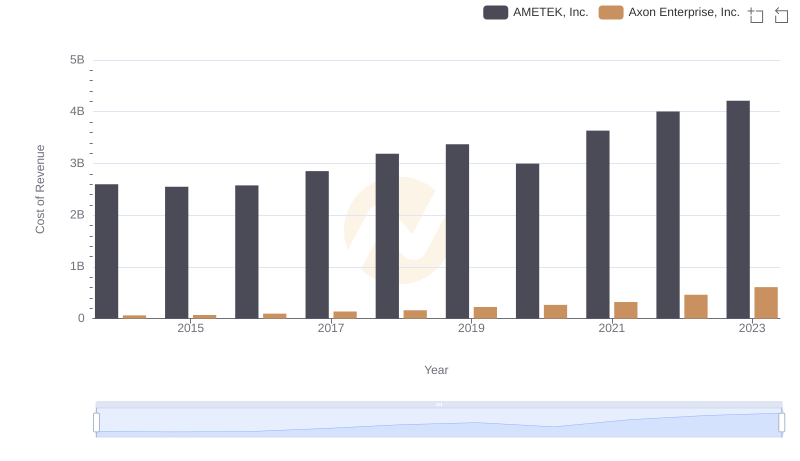
Cost of Revenue: Key Insights for Axon Enterprise, Inc. and AMETEK, Inc.
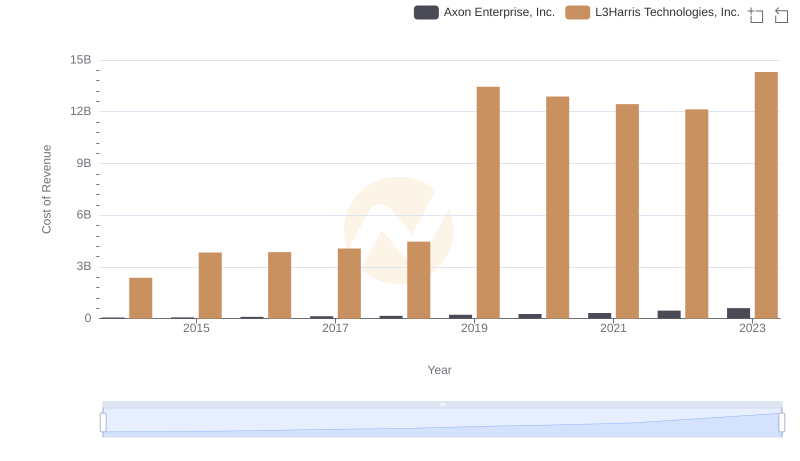
Axon Enterprise, Inc. vs L3Harris Technologies, Inc.: Efficiency in Cost of Revenue Explored

Cost of Revenue Trends: Axon Enterprise, Inc. vs Ferguson plc
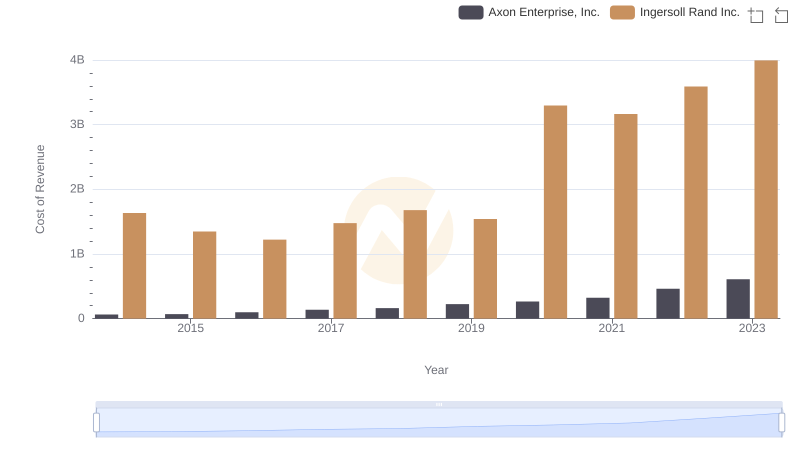
Analyzing Cost of Revenue: Axon Enterprise, Inc. and Ingersoll Rand Inc.
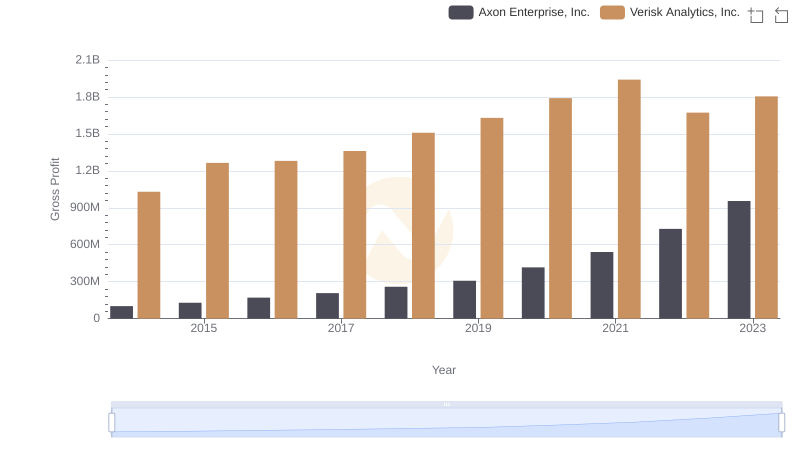
Gross Profit Trends Compared: Axon Enterprise, Inc. vs Verisk Analytics, Inc.
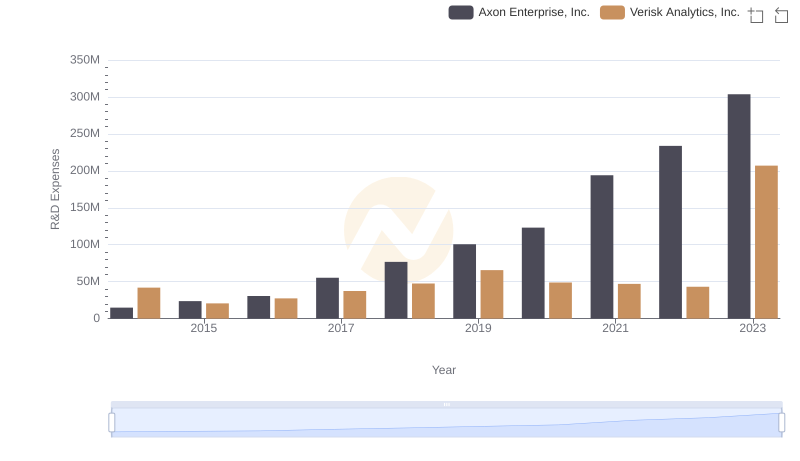
Research and Development Expenses Breakdown: Axon Enterprise, Inc. vs Verisk Analytics, Inc.
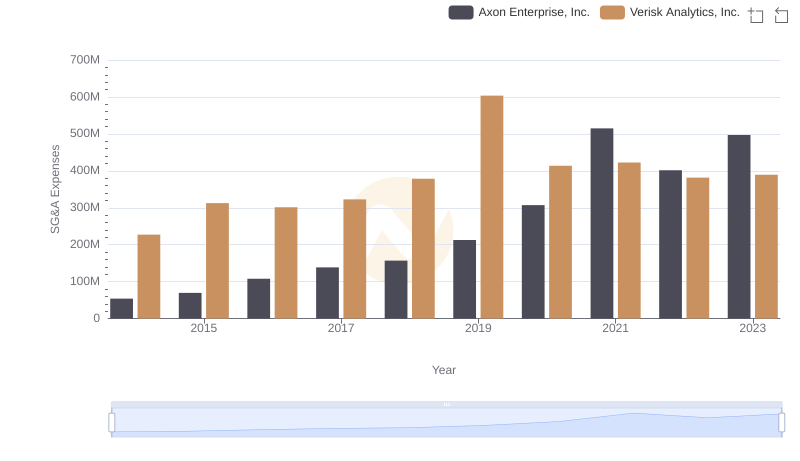
Axon Enterprise, Inc. vs Verisk Analytics, Inc.: SG&A Expense Trends