| __timestamp | Axon Enterprise, Inc. | Nordson Corporation |
|---|---|---|
| Wednesday, January 1, 2014 | 54158000 | 577993000 |
| Thursday, January 1, 2015 | 69698000 | 596234000 |
| Friday, January 1, 2016 | 108076000 | 605068000 |
| Sunday, January 1, 2017 | 138692000 | 681299000 |
| Monday, January 1, 2018 | 156886000 | 741408000 |
| Tuesday, January 1, 2019 | 212959000 | 708990000 |
| Wednesday, January 1, 2020 | 307286000 | 693552000 |
| Friday, January 1, 2021 | 515007000 | 708953000 |
| Saturday, January 1, 2022 | 401575000 | 724176000 |
| Sunday, January 1, 2023 | 496874000 | 681244000 |
| Monday, January 1, 2024 | 812128000 |
In pursuit of knowledge
In the ever-evolving landscape of corporate finance, understanding the spending patterns of industry leaders is crucial. Axon Enterprise, Inc. and Nordson Corporation, two giants in their respective fields, have shown distinct trends in their Selling, General, and Administrative (SG&A) expenses over the past decade.
From 2014 to 2023, Axon Enterprise's SG&A expenses surged by over 800%, reflecting its aggressive growth strategy and expansion efforts. In contrast, Nordson Corporation maintained a more stable trajectory, with a modest increase of around 18% during the same period. This stability underscores Nordson's focus on efficiency and consistent performance.
Interestingly, 2021 marked a peak year for Axon, with expenses reaching their highest point, while Nordson's spending remained relatively steady. The data for 2024 is incomplete, highlighting the dynamic nature of financial forecasting. These insights offer a glimpse into the strategic priorities of these companies, providing valuable lessons for investors and industry analysts alike.
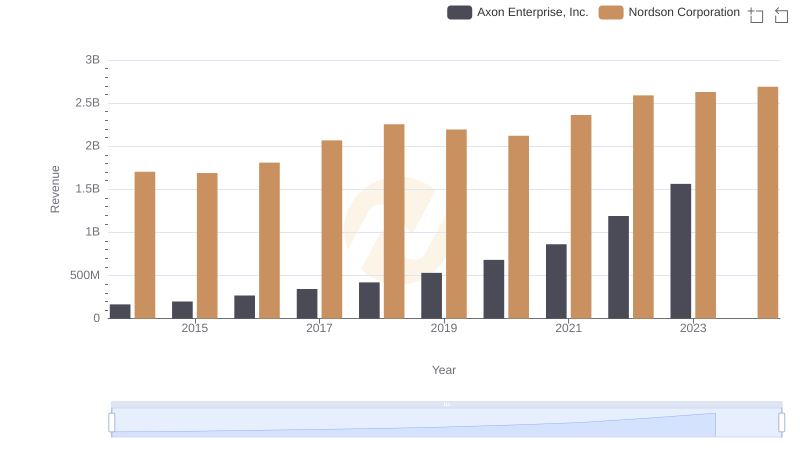
Axon Enterprise, Inc. vs Nordson Corporation: Annual Revenue Growth Compared
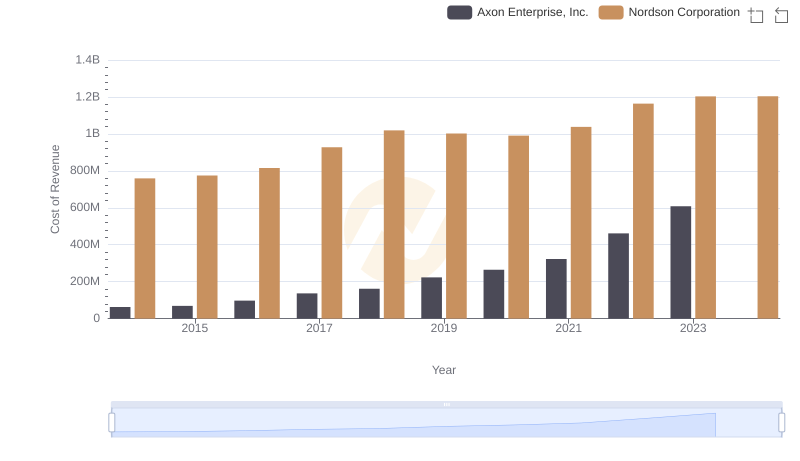
Cost of Revenue Trends: Axon Enterprise, Inc. vs Nordson Corporation
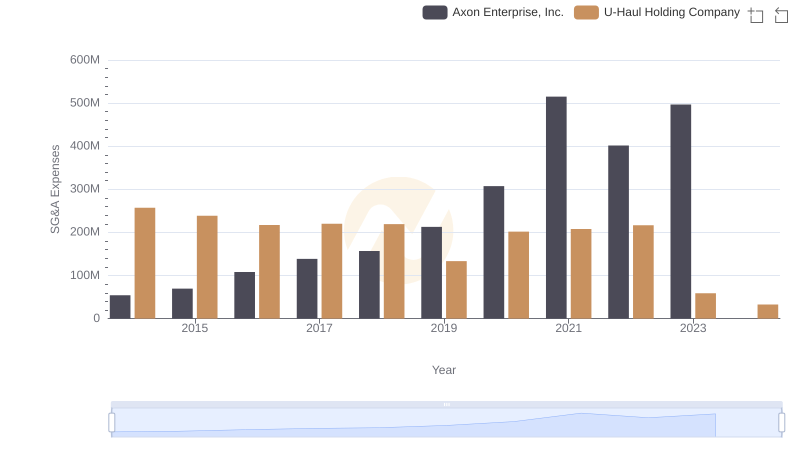
Cost Management Insights: SG&A Expenses for Axon Enterprise, Inc. and U-Haul Holding Company
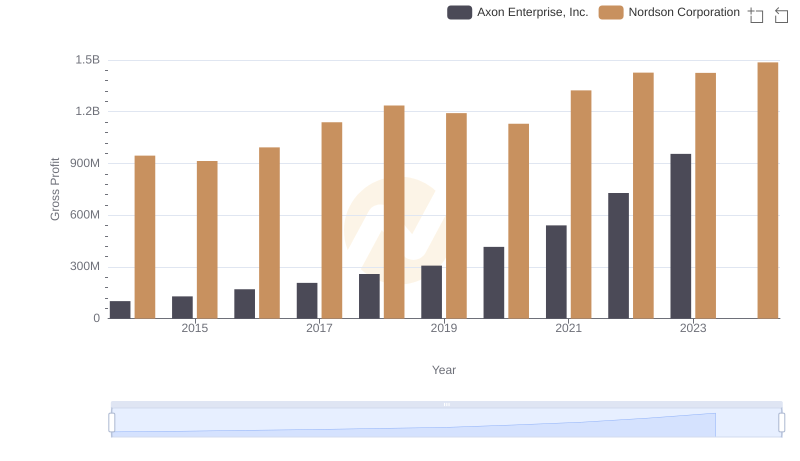
Axon Enterprise, Inc. vs Nordson Corporation: A Gross Profit Performance Breakdown
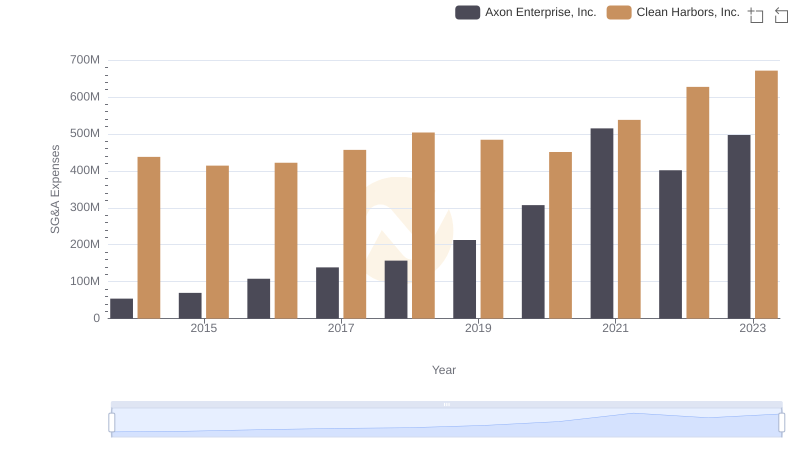
Comparing SG&A Expenses: Axon Enterprise, Inc. vs Clean Harbors, Inc. Trends and Insights
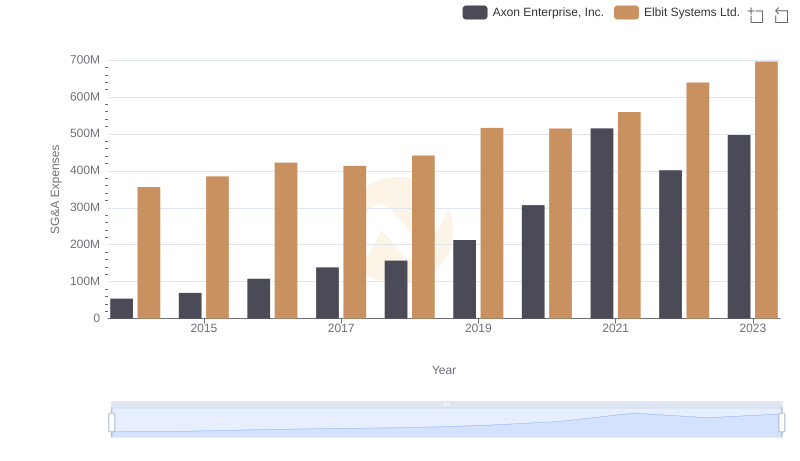
Comparing SG&A Expenses: Axon Enterprise, Inc. vs Elbit Systems Ltd. Trends and Insights
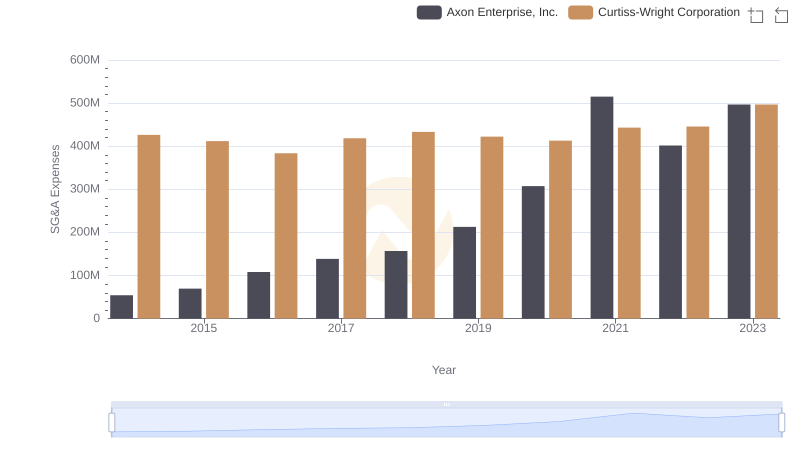
Comparing SG&A Expenses: Axon Enterprise, Inc. vs Curtiss-Wright Corporation Trends and Insights
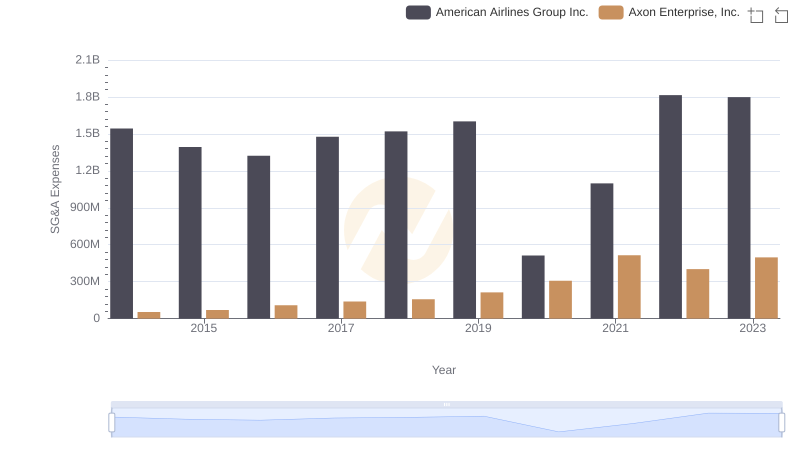
Who Optimizes SG&A Costs Better? Axon Enterprise, Inc. or American Airlines Group Inc.
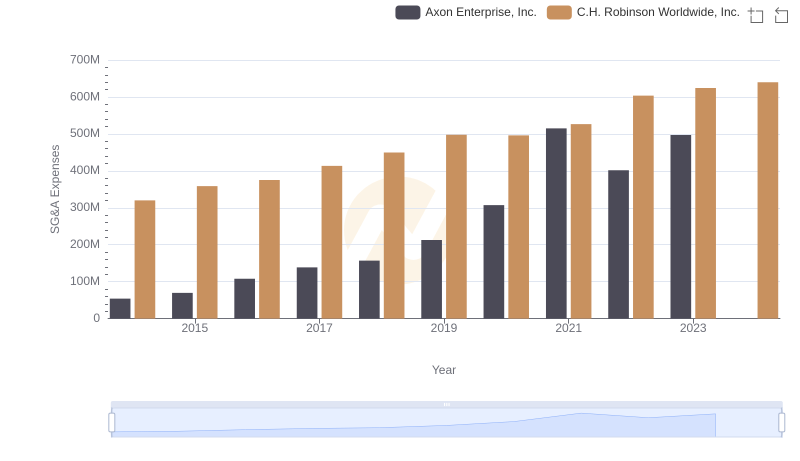
Axon Enterprise, Inc. vs C.H. Robinson Worldwide, Inc.: SG&A Expense Trends
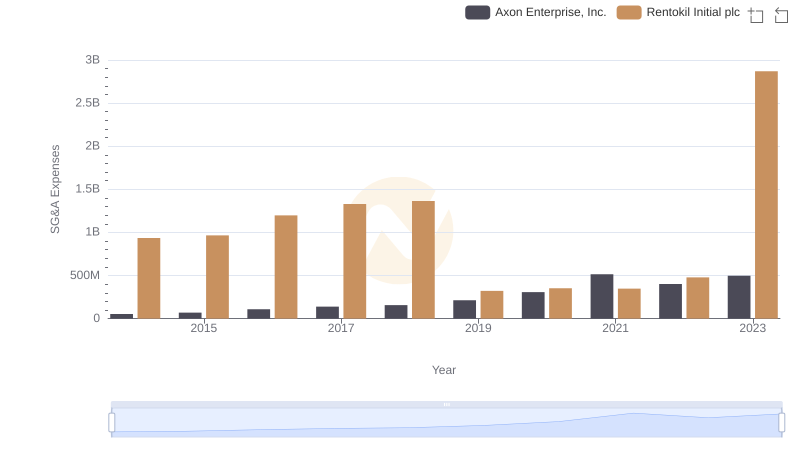
Axon Enterprise, Inc. vs Rentokil Initial plc: SG&A Expense Trends
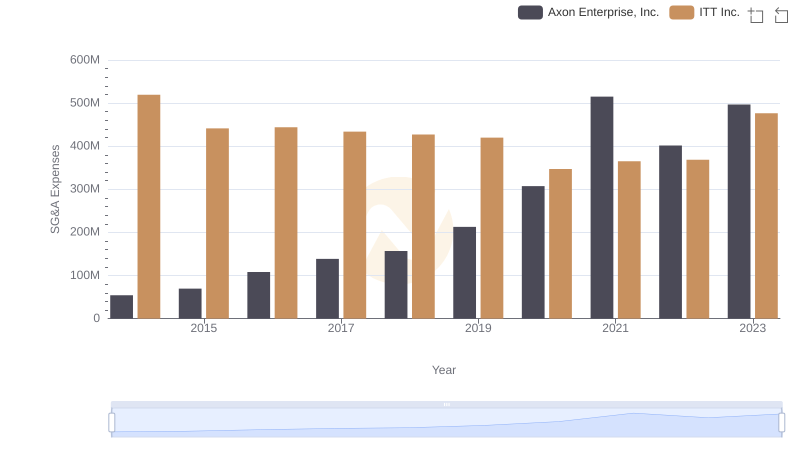
Axon Enterprise, Inc. vs ITT Inc.: SG&A Expense Trends
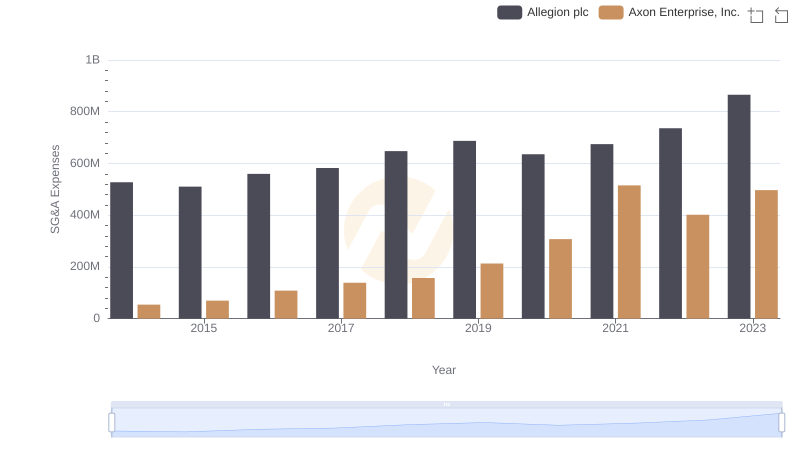
Who Optimizes SG&A Costs Better? Axon Enterprise, Inc. or Allegion plc