| __timestamp | Allegion plc | Axon Enterprise, Inc. |
|---|---|---|
| Wednesday, January 1, 2014 | 527400000 | 54158000 |
| Thursday, January 1, 2015 | 510500000 | 69698000 |
| Friday, January 1, 2016 | 559800000 | 108076000 |
| Sunday, January 1, 2017 | 582500000 | 138692000 |
| Monday, January 1, 2018 | 647500000 | 156886000 |
| Tuesday, January 1, 2019 | 687200000 | 212959000 |
| Wednesday, January 1, 2020 | 635700000 | 307286000 |
| Friday, January 1, 2021 | 674700000 | 515007000 |
| Saturday, January 1, 2022 | 736000000 | 401575000 |
| Sunday, January 1, 2023 | 865600000 | 496874000 |
| Monday, January 1, 2024 | 887800000 |
Infusing magic into the data realm
In the competitive landscape of corporate finance, managing Selling, General, and Administrative (SG&A) expenses is crucial for profitability. This analysis compares the SG&A cost optimization strategies of Axon Enterprise, Inc. and Allegion plc from 2014 to 2023. Over this period, Allegion plc consistently reported higher SG&A expenses, peaking at approximately 866 million in 2023, reflecting a 64% increase from 2014. In contrast, Axon Enterprise, Inc. demonstrated a more dynamic growth, with SG&A expenses rising from about 54 million in 2014 to nearly 497 million in 2023, marking an impressive 817% surge. This stark difference highlights Axon's aggressive expansion strategy, while Allegion's steady increase suggests a more conservative approach. Understanding these trends provides valuable insights into each company's operational priorities and market strategies.
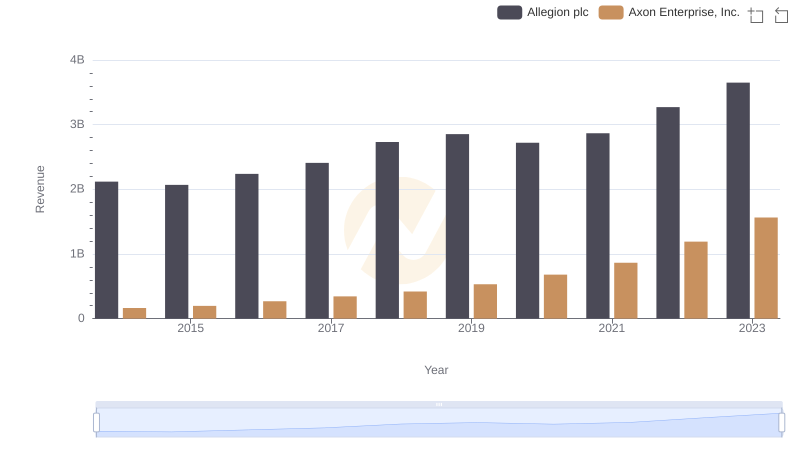
Axon Enterprise, Inc. vs Allegion plc: Annual Revenue Growth Compared
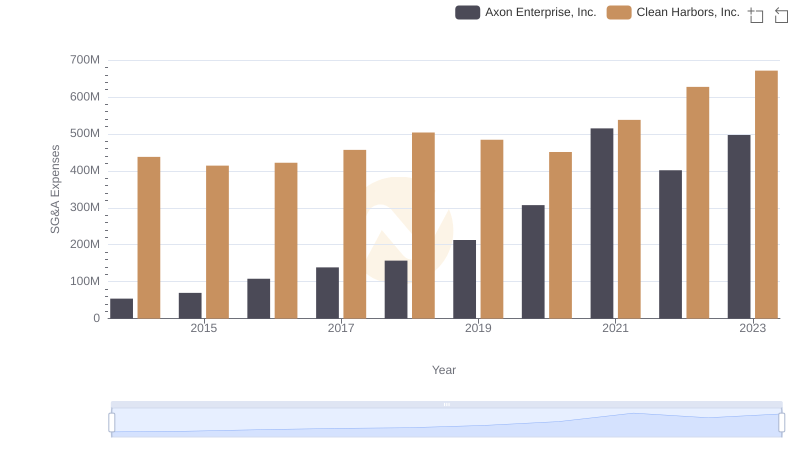
Comparing SG&A Expenses: Axon Enterprise, Inc. vs Clean Harbors, Inc. Trends and Insights
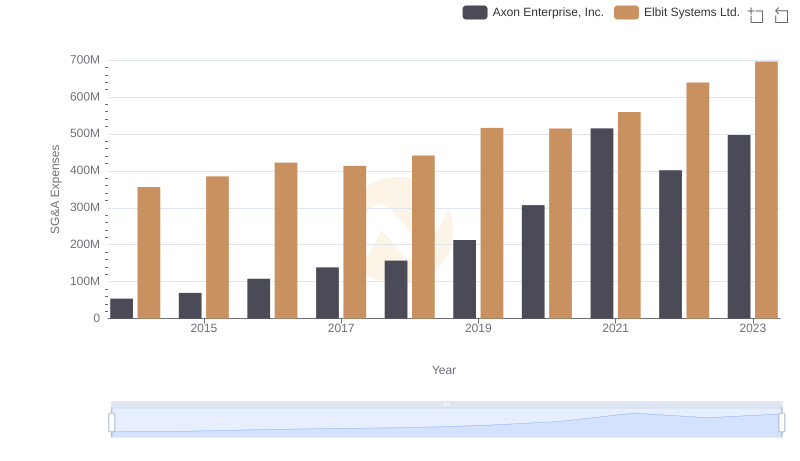
Comparing SG&A Expenses: Axon Enterprise, Inc. vs Elbit Systems Ltd. Trends and Insights
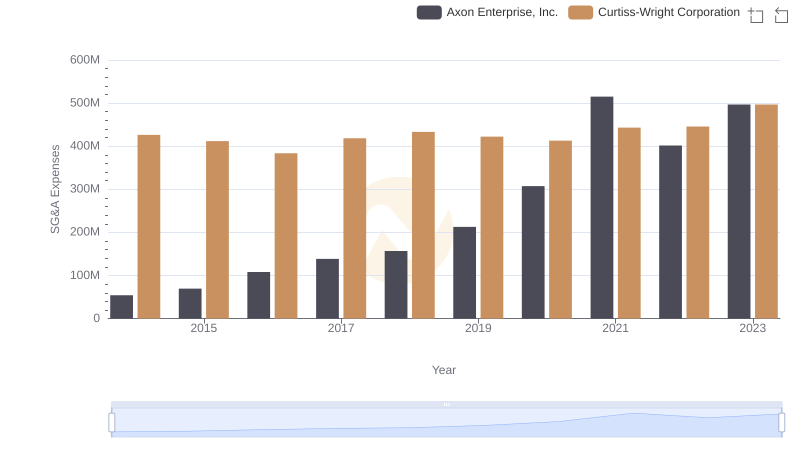
Comparing SG&A Expenses: Axon Enterprise, Inc. vs Curtiss-Wright Corporation Trends and Insights
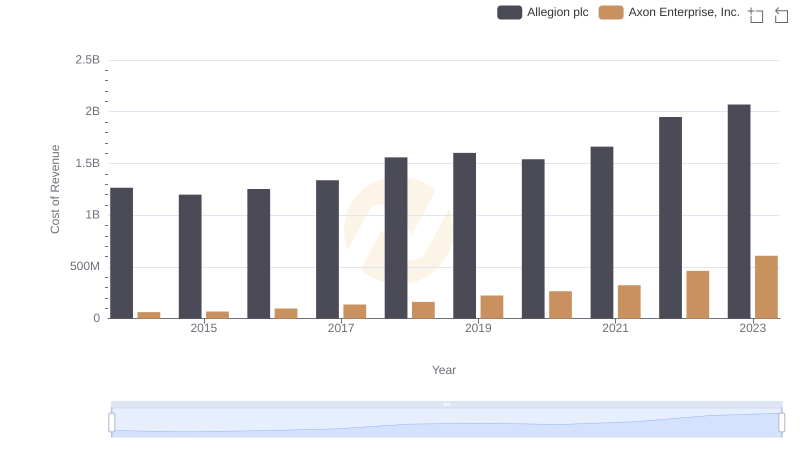
Axon Enterprise, Inc. vs Allegion plc: Efficiency in Cost of Revenue Explored
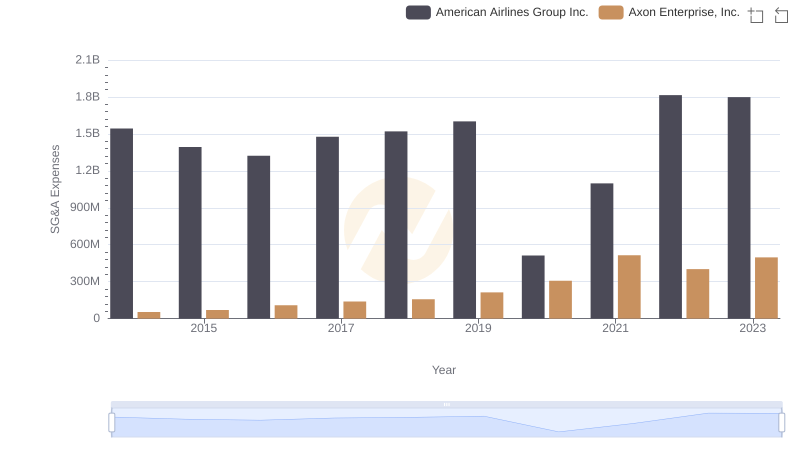
Who Optimizes SG&A Costs Better? Axon Enterprise, Inc. or American Airlines Group Inc.
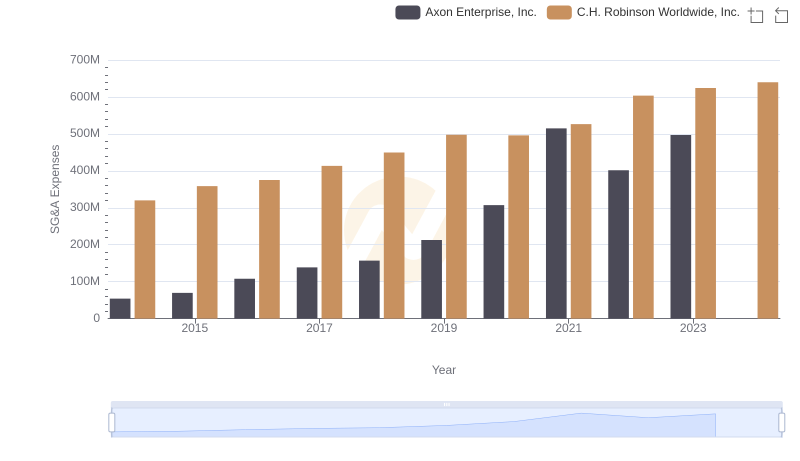
Axon Enterprise, Inc. vs C.H. Robinson Worldwide, Inc.: SG&A Expense Trends
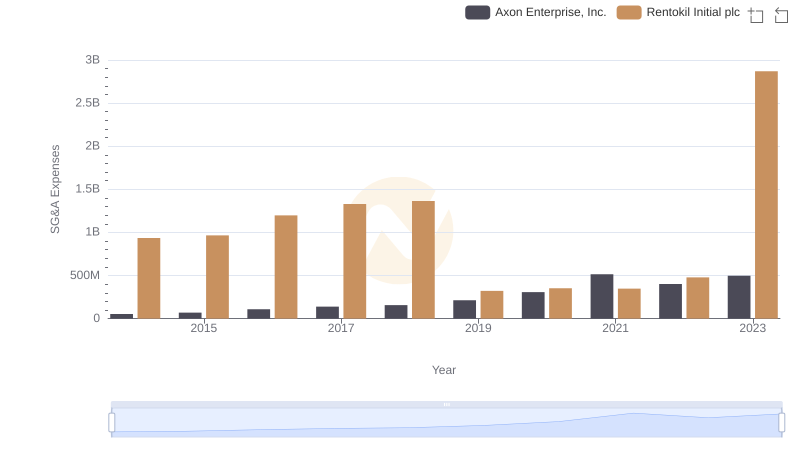
Axon Enterprise, Inc. vs Rentokil Initial plc: SG&A Expense Trends
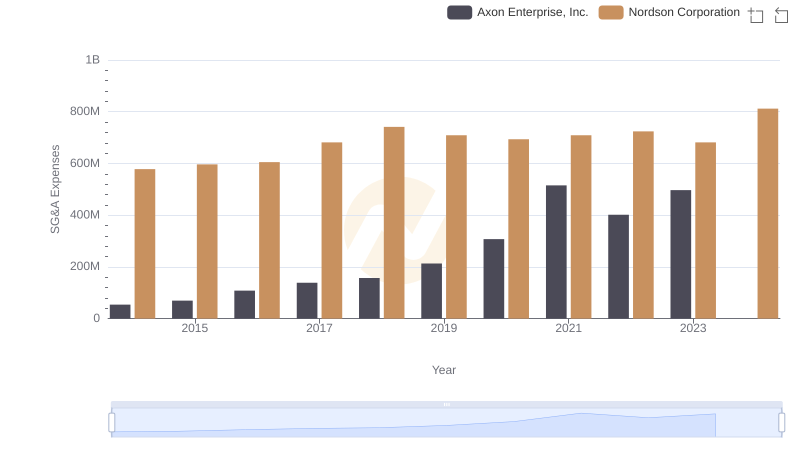
Axon Enterprise, Inc. and Nordson Corporation: SG&A Spending Patterns Compared
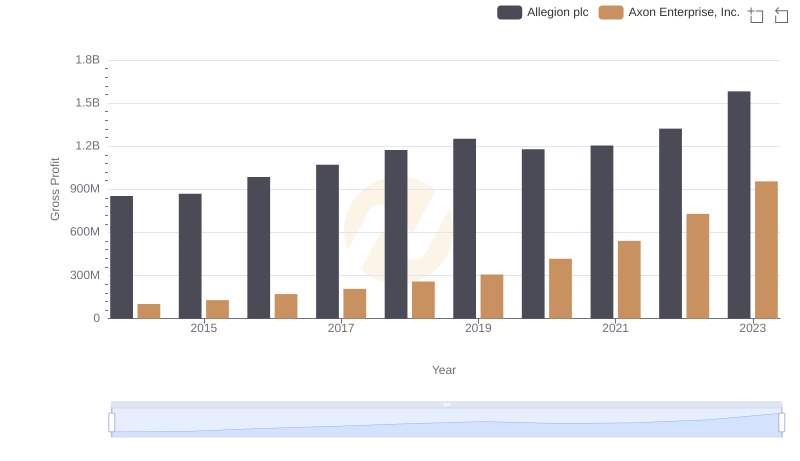
Gross Profit Comparison: Axon Enterprise, Inc. and Allegion plc Trends
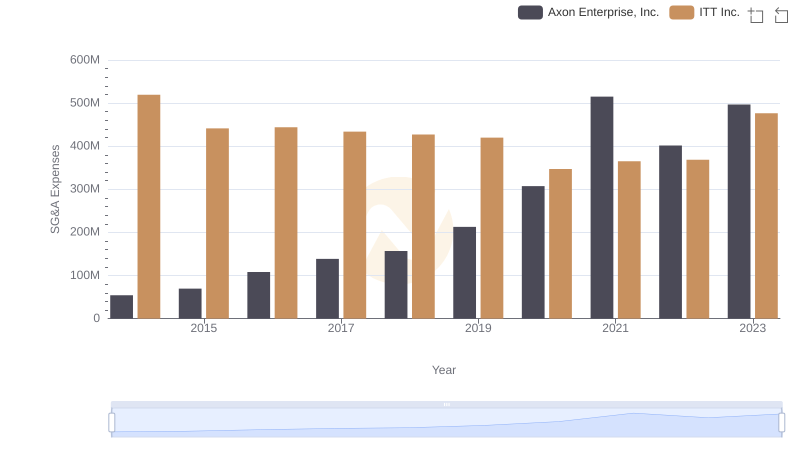
Axon Enterprise, Inc. vs ITT Inc.: SG&A Expense Trends

Research and Development Investment: Axon Enterprise, Inc. vs Allegion plc