| __timestamp | Axon Enterprise, Inc. | Nordson Corporation |
|---|---|---|
| Wednesday, January 1, 2014 | 164525000 | 1704021000 |
| Thursday, January 1, 2015 | 197892000 | 1688666000 |
| Friday, January 1, 2016 | 268245000 | 1808994000 |
| Sunday, January 1, 2017 | 343798000 | 2066982000 |
| Monday, January 1, 2018 | 420068000 | 2254668000 |
| Tuesday, January 1, 2019 | 530860000 | 2194226000 |
| Wednesday, January 1, 2020 | 681003000 | 2121100000 |
| Friday, January 1, 2021 | 863381000 | 2362209000 |
| Saturday, January 1, 2022 | 1189935000 | 2590278000 |
| Sunday, January 1, 2023 | 1563391000 | 2628632000 |
| Monday, January 1, 2024 | 2689921000 |
Cracking the code
In the dynamic world of business, revenue growth is a key indicator of a company's success. Over the past decade, Axon Enterprise, Inc. and Nordson Corporation have showcased contrasting growth trajectories. From 2014 to 2023, Axon Enterprise, Inc. has seen a remarkable revenue increase of nearly 850%, starting from $165 million to over $1.56 billion. This growth reflects Axon's strategic innovations in public safety technology.
Conversely, Nordson Corporation, a leader in precision technology, has experienced a steady yet modest growth of around 54% during the same period, with revenues rising from $1.7 billion to approximately $2.63 billion. While Nordson's growth is consistent, it highlights the stability and reliability of its market presence.
The data for 2024 is incomplete for Axon, but Nordson continues its upward trend, projecting further growth. This comparison underscores the diverse strategies and market dynamics shaping these two industry giants.
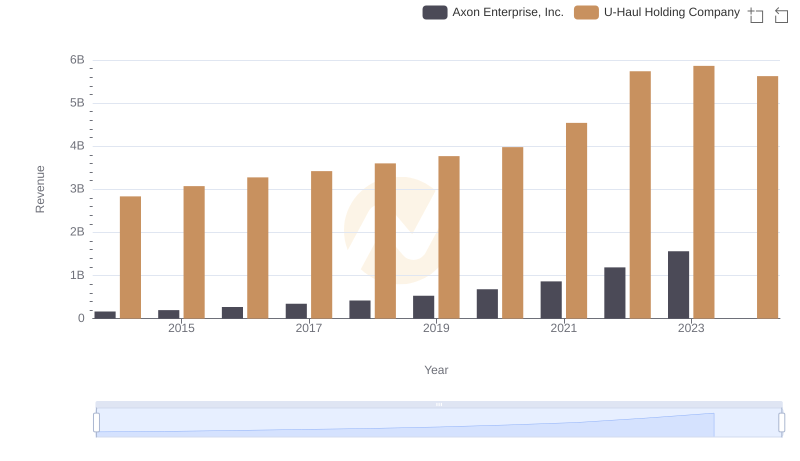
Who Generates More Revenue? Axon Enterprise, Inc. or U-Haul Holding Company
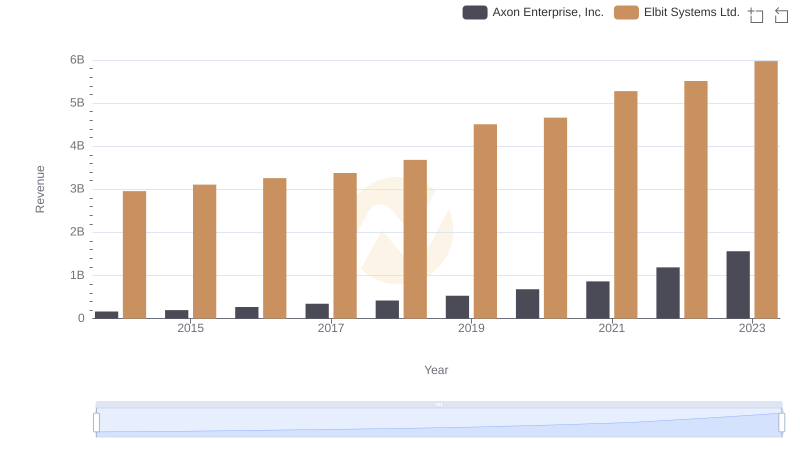
Revenue Insights: Axon Enterprise, Inc. and Elbit Systems Ltd. Performance Compared
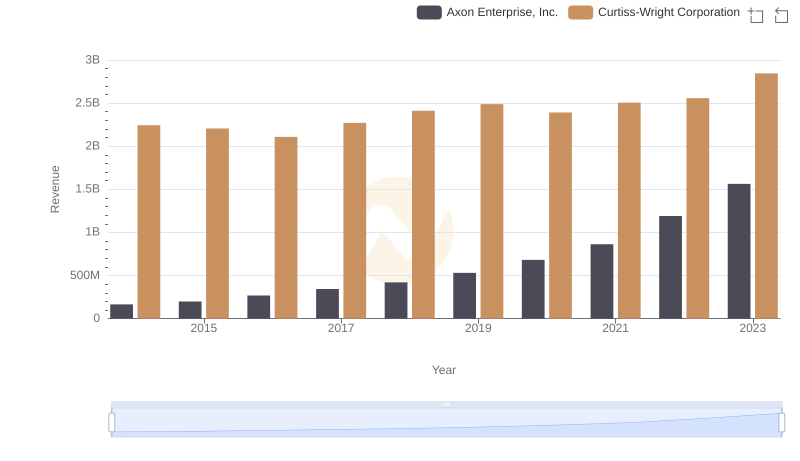
Annual Revenue Comparison: Axon Enterprise, Inc. vs Curtiss-Wright Corporation
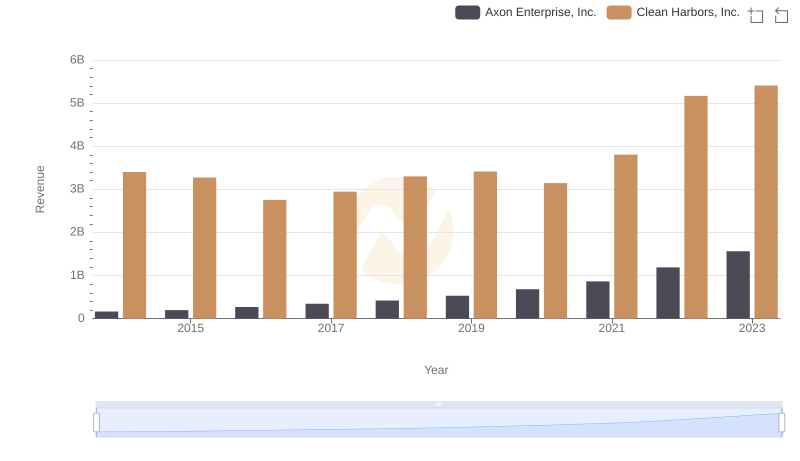
Comparing Revenue Performance: Axon Enterprise, Inc. or Clean Harbors, Inc.?
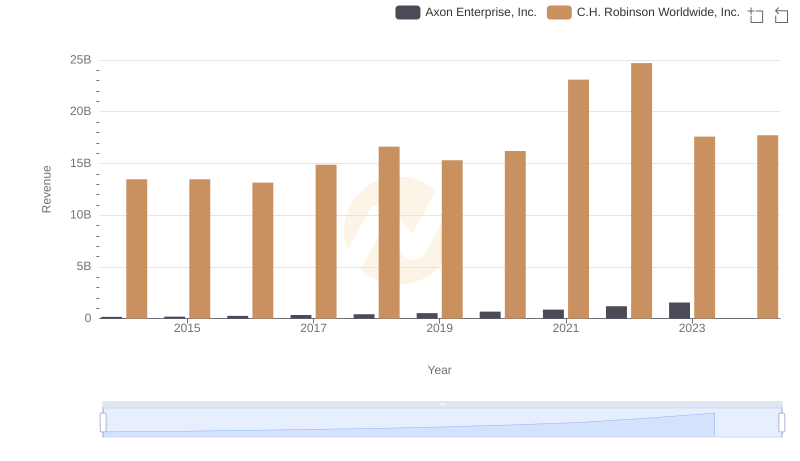
Annual Revenue Comparison: Axon Enterprise, Inc. vs C.H. Robinson Worldwide, Inc.
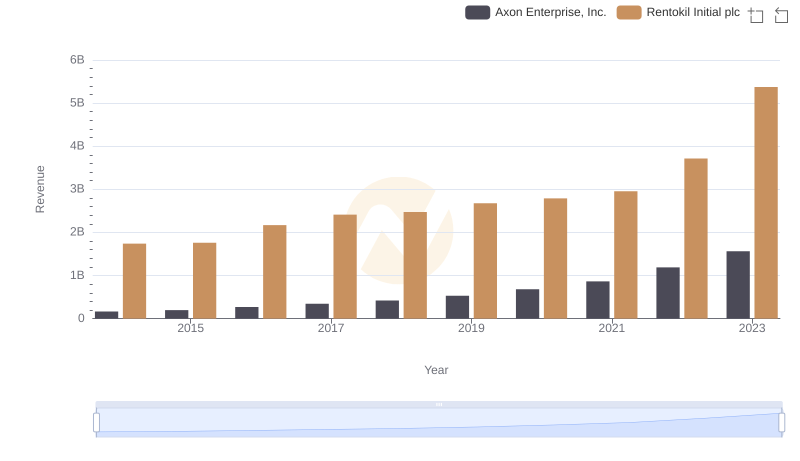
Who Generates More Revenue? Axon Enterprise, Inc. or Rentokil Initial plc
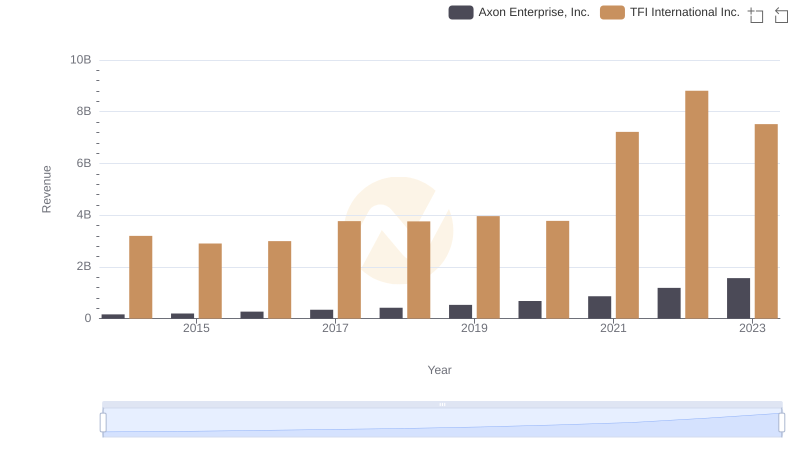
Axon Enterprise, Inc. vs TFI International Inc.: Examining Key Revenue Metrics
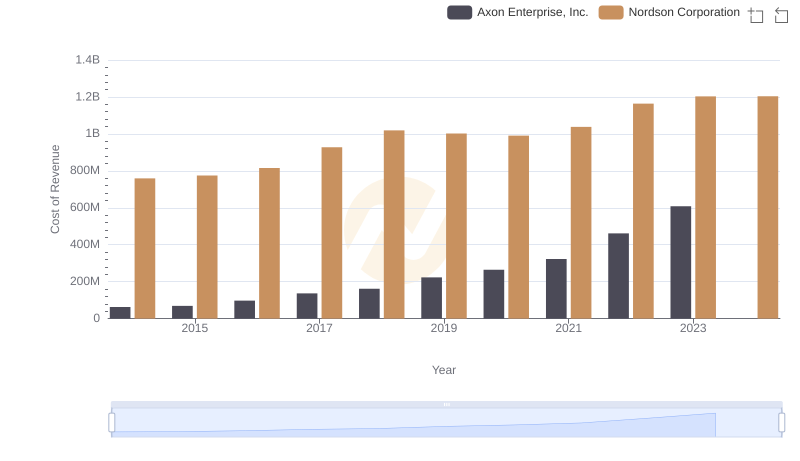
Cost of Revenue Trends: Axon Enterprise, Inc. vs Nordson Corporation
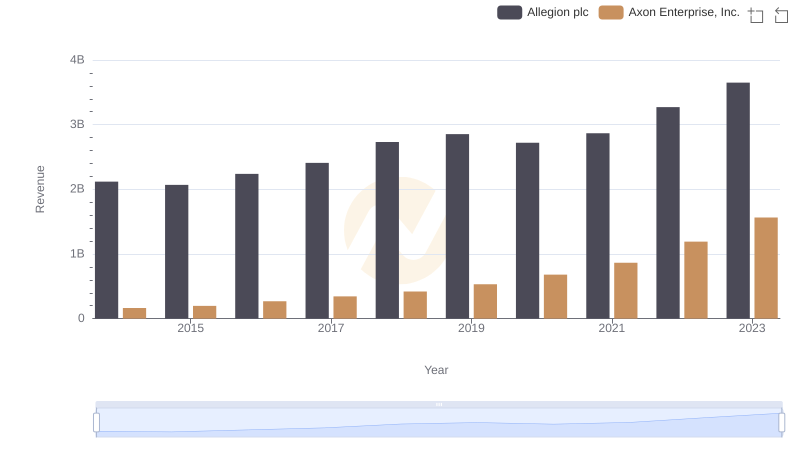
Axon Enterprise, Inc. vs Allegion plc: Annual Revenue Growth Compared
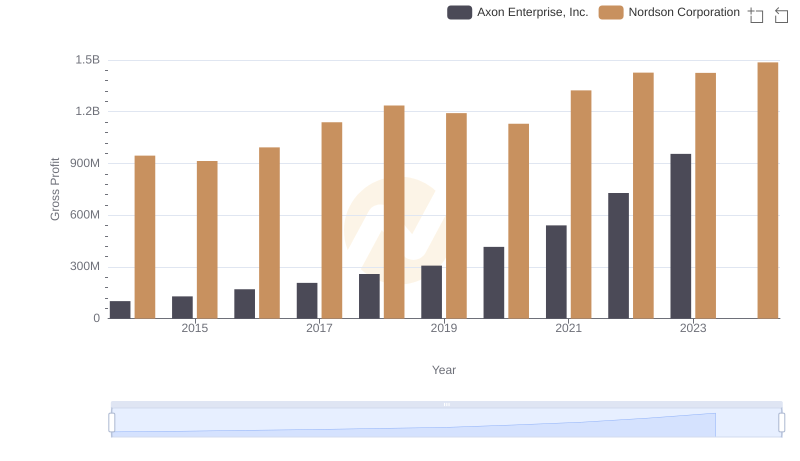
Axon Enterprise, Inc. vs Nordson Corporation: A Gross Profit Performance Breakdown
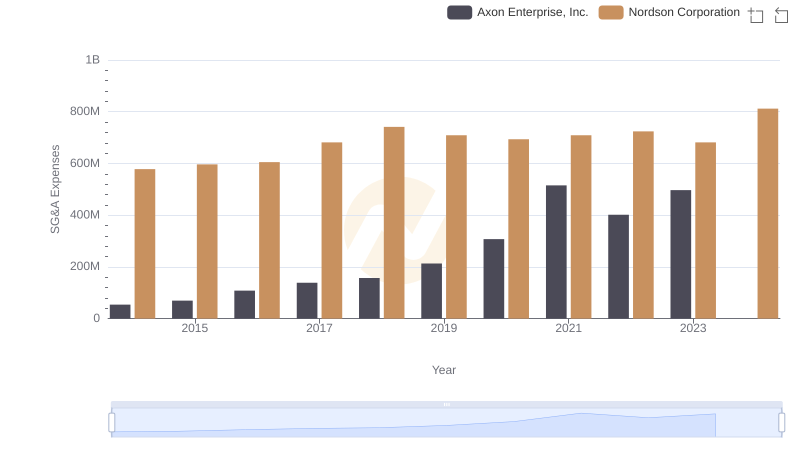
Axon Enterprise, Inc. and Nordson Corporation: SG&A Spending Patterns Compared