| __timestamp | Axon Enterprise, Inc. | C.H. Robinson Worldwide, Inc. |
|---|---|---|
| Wednesday, January 1, 2014 | 54158000 | 320213000 |
| Thursday, January 1, 2015 | 69698000 | 358760000 |
| Friday, January 1, 2016 | 108076000 | 375061000 |
| Sunday, January 1, 2017 | 138692000 | 413404000 |
| Monday, January 1, 2018 | 156886000 | 449610000 |
| Tuesday, January 1, 2019 | 212959000 | 497806000 |
| Wednesday, January 1, 2020 | 307286000 | 496122000 |
| Friday, January 1, 2021 | 515007000 | 526371000 |
| Saturday, January 1, 2022 | 401575000 | 603415000 |
| Sunday, January 1, 2023 | 496874000 | 624266000 |
| Monday, January 1, 2024 | 639624000 |
Unveiling the hidden dimensions of data
In the ever-evolving landscape of corporate finance, understanding the trends in Selling, General, and Administrative (SG&A) expenses is crucial for investors and analysts alike. Over the past decade, Axon Enterprise, Inc. and C.H. Robinson Worldwide, Inc. have shown distinct trajectories in their SG&A expenditures.
From 2014 to 2023, Axon Enterprise, Inc. experienced a remarkable increase in SG&A expenses, growing by approximately 817%, reflecting its aggressive expansion and investment in operational capabilities. In contrast, C.H. Robinson Worldwide, Inc. demonstrated a steadier growth of around 95% over the same period, indicative of its stable market position and consistent operational strategies.
Interestingly, while Axon saw a dip in 2022, C.H. Robinson continued its upward trend, highlighting differing strategic responses to market conditions. This analysis provides a window into the financial strategies of these industry leaders, offering valuable insights for stakeholders.
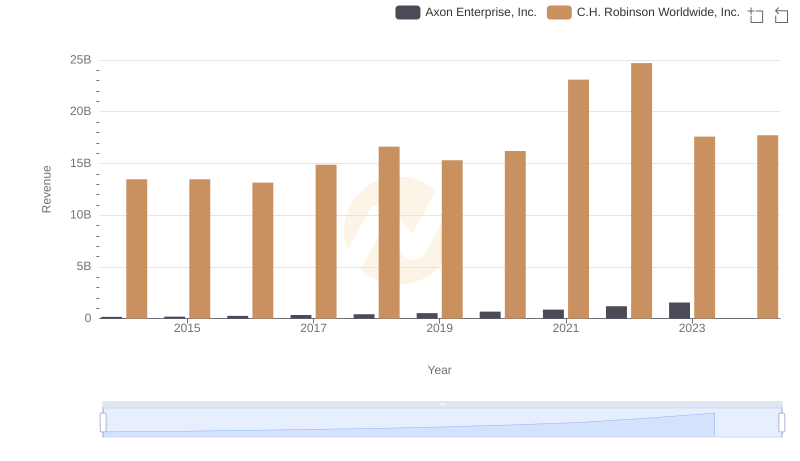
Annual Revenue Comparison: Axon Enterprise, Inc. vs C.H. Robinson Worldwide, Inc.
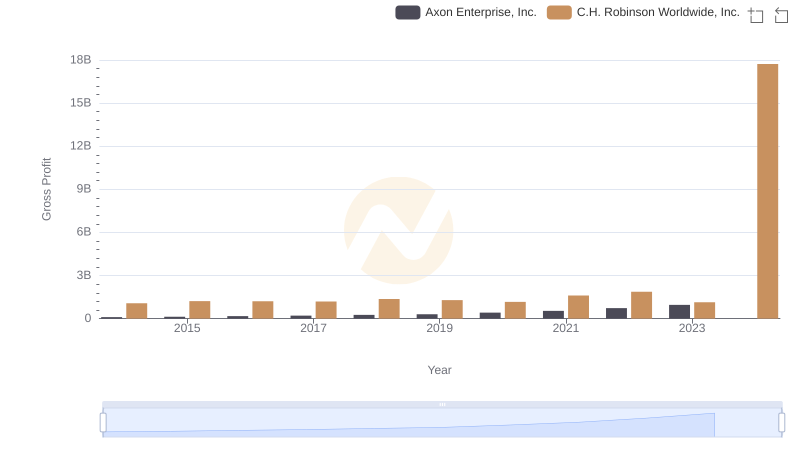
Gross Profit Trends Compared: Axon Enterprise, Inc. vs C.H. Robinson Worldwide, Inc.
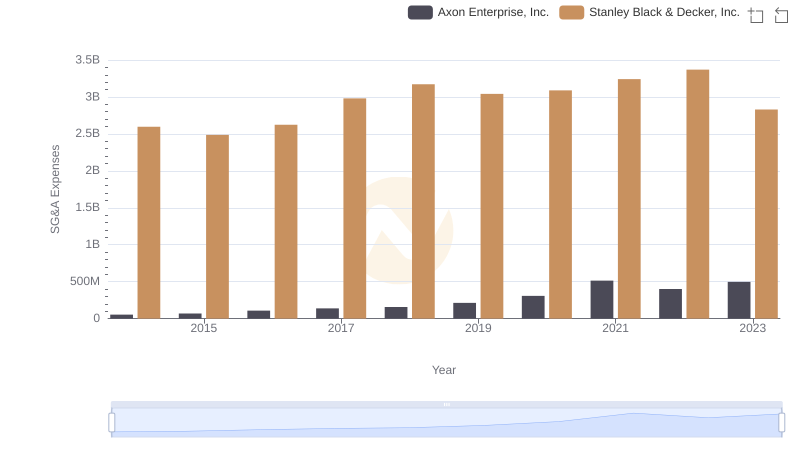
Axon Enterprise, Inc. vs Stanley Black & Decker, Inc.: SG&A Expense Trends
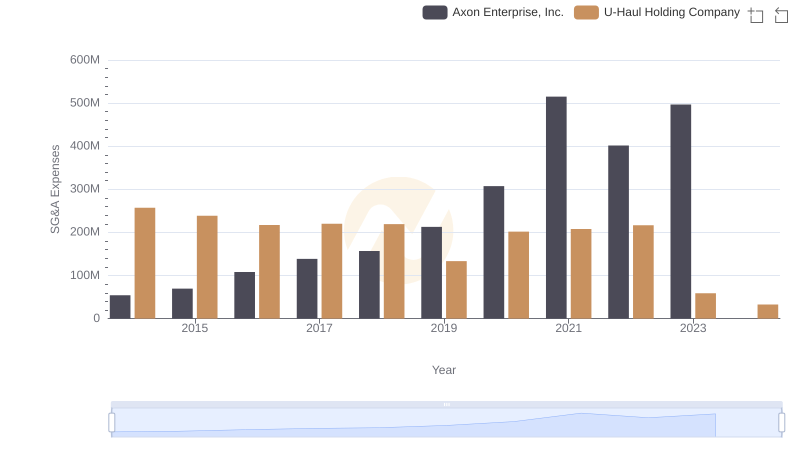
Cost Management Insights: SG&A Expenses for Axon Enterprise, Inc. and U-Haul Holding Company
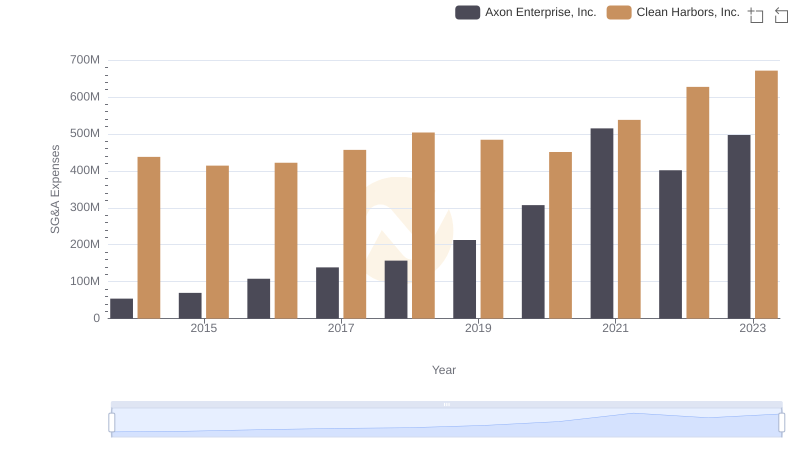
Comparing SG&A Expenses: Axon Enterprise, Inc. vs Clean Harbors, Inc. Trends and Insights
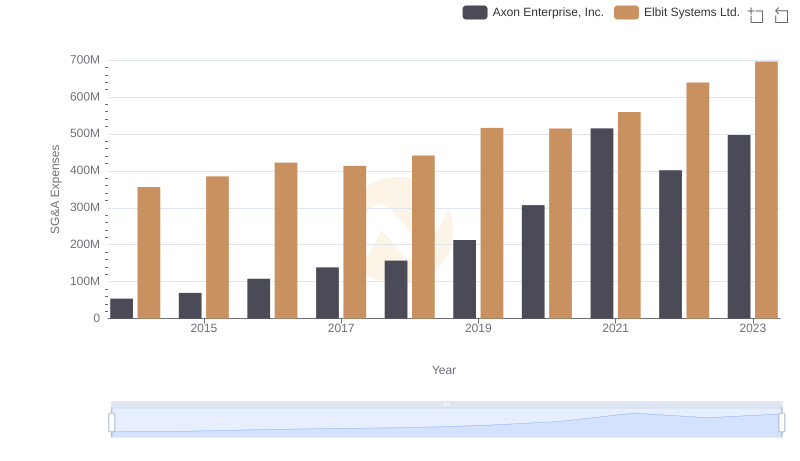
Comparing SG&A Expenses: Axon Enterprise, Inc. vs Elbit Systems Ltd. Trends and Insights
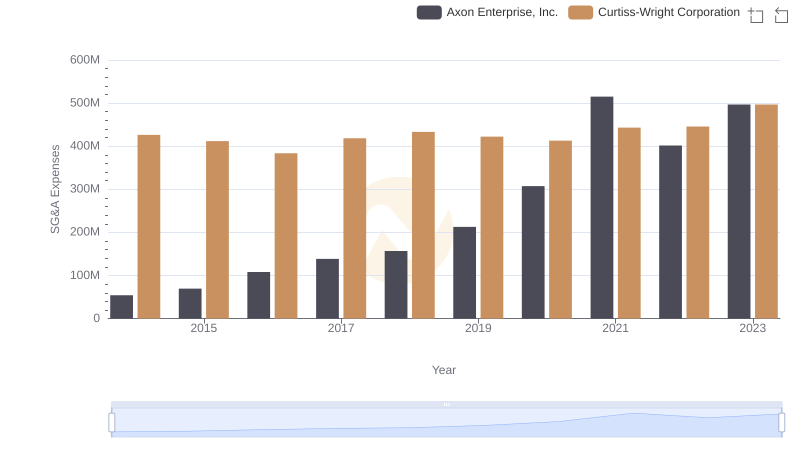
Comparing SG&A Expenses: Axon Enterprise, Inc. vs Curtiss-Wright Corporation Trends and Insights
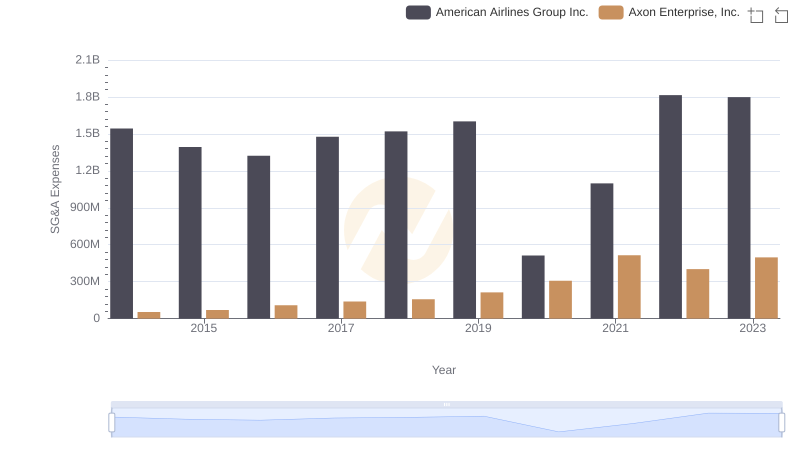
Who Optimizes SG&A Costs Better? Axon Enterprise, Inc. or American Airlines Group Inc.
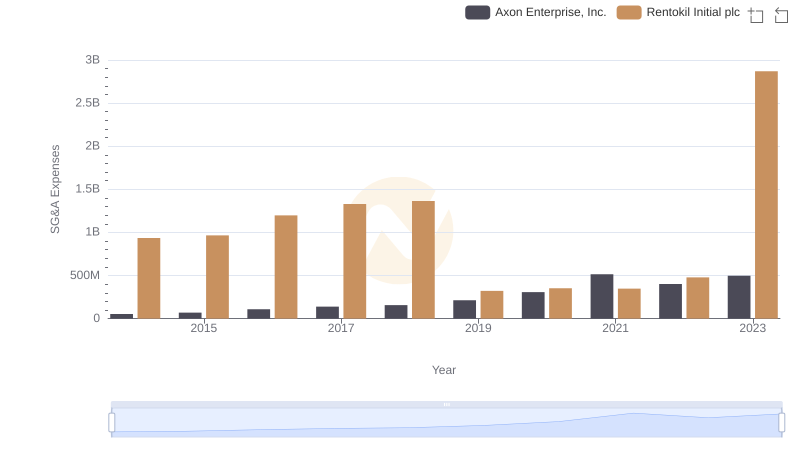
Axon Enterprise, Inc. vs Rentokil Initial plc: SG&A Expense Trends
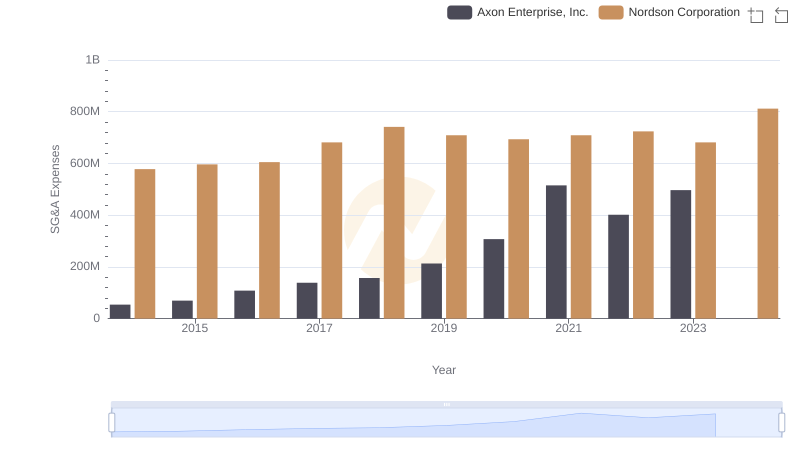
Axon Enterprise, Inc. and Nordson Corporation: SG&A Spending Patterns Compared
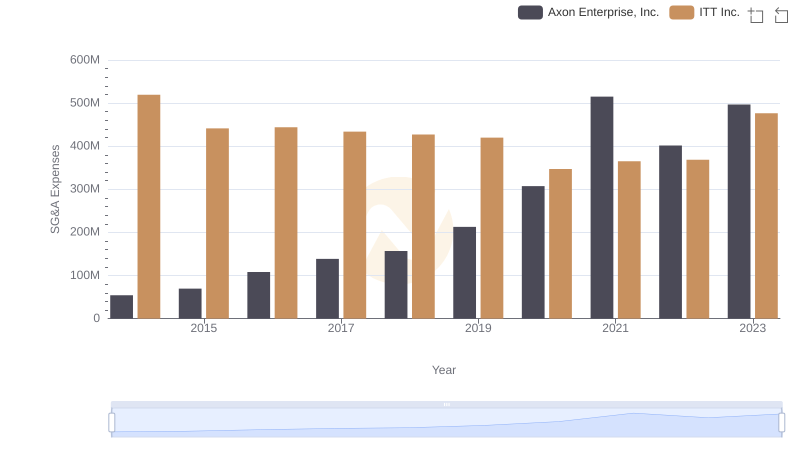
Axon Enterprise, Inc. vs ITT Inc.: SG&A Expense Trends