| __timestamp | Axon Enterprise, Inc. | Nordson Corporation |
|---|---|---|
| Wednesday, January 1, 2014 | 101548000 | 945098000 |
| Thursday, January 1, 2015 | 128647000 | 913964000 |
| Friday, January 1, 2016 | 170536000 | 993499000 |
| Sunday, January 1, 2017 | 207088000 | 1139001000 |
| Monday, January 1, 2018 | 258583000 | 1235965000 |
| Tuesday, January 1, 2019 | 307286000 | 1192103000 |
| Wednesday, January 1, 2020 | 416331000 | 1130468000 |
| Friday, January 1, 2021 | 540910000 | 1324080000 |
| Saturday, January 1, 2022 | 728638000 | 1426536000 |
| Sunday, January 1, 2023 | 955382000 | 1425405000 |
| Monday, January 1, 2024 | 1486129000 |
Unleashing the power of data
In the ever-evolving landscape of corporate performance, Axon Enterprise, Inc. and Nordson Corporation stand as intriguing case studies. Over the past decade, from 2014 to 2023, these companies have showcased distinct trajectories in gross profit growth. Axon Enterprise, Inc. has experienced a remarkable surge, with its gross profit increasing nearly tenfold, from approximately $101 million in 2014 to an impressive $955 million in 2023. This represents an average annual growth rate of around 30%.
In contrast, Nordson Corporation, a stalwart in its industry, has maintained a steady growth pattern. Starting at $945 million in 2014, it reached $1.425 billion by 2023, reflecting a more modest annual growth rate of about 5%. Notably, Nordson's consistent performance underscores its resilience and market stability.
While Axon's rapid ascent is noteworthy, Nordson's steady climb highlights the diverse strategies companies employ to achieve success. This comparison offers valuable insights into the dynamics of corporate growth and profitability.
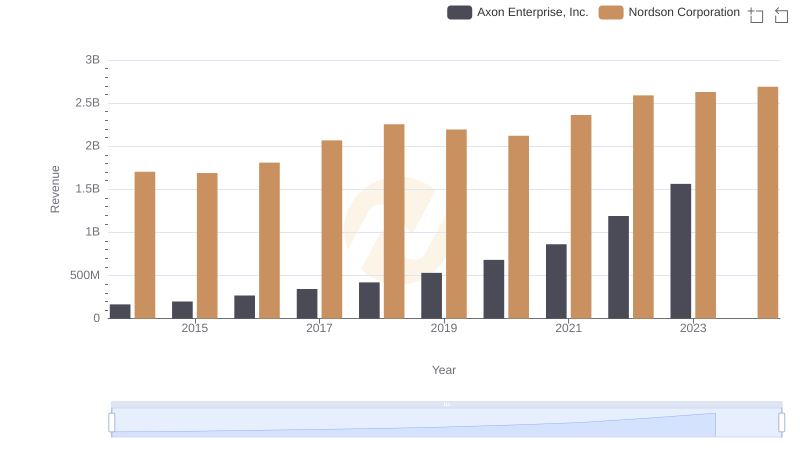
Axon Enterprise, Inc. vs Nordson Corporation: Annual Revenue Growth Compared
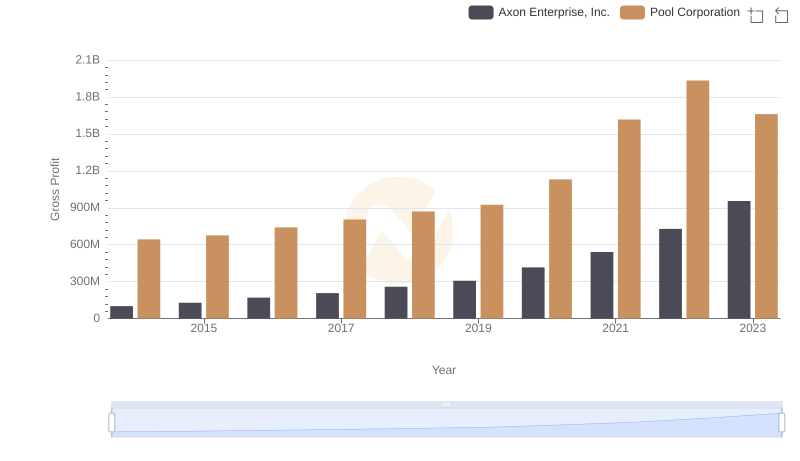
Gross Profit Analysis: Comparing Axon Enterprise, Inc. and Pool Corporation
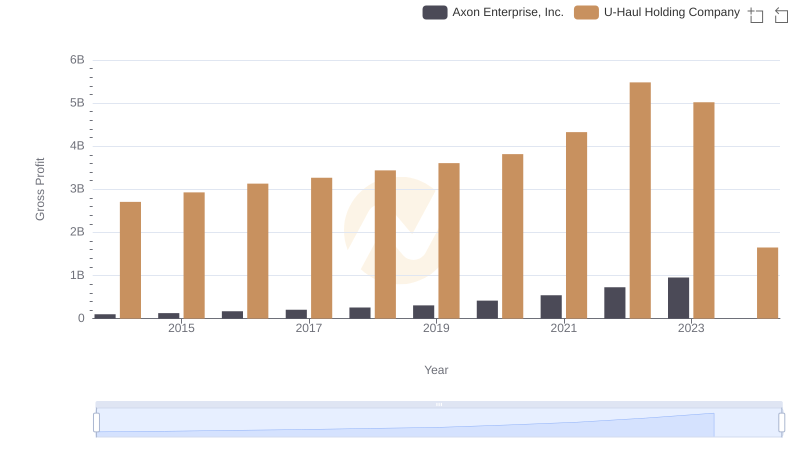
Gross Profit Analysis: Comparing Axon Enterprise, Inc. and U-Haul Holding Company
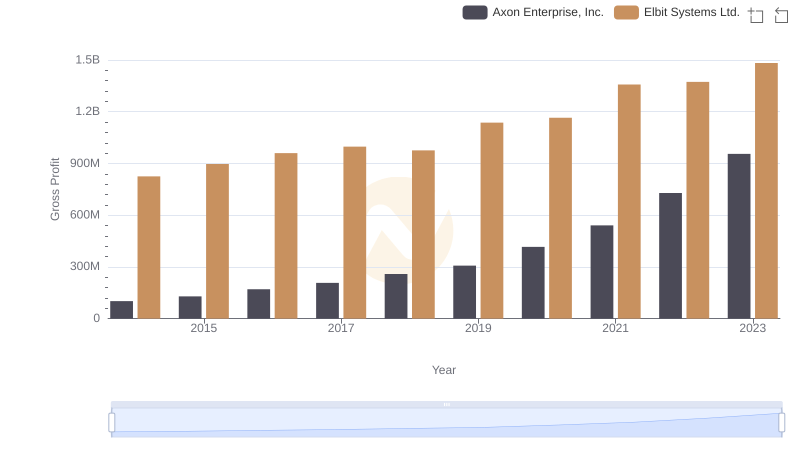
Gross Profit Analysis: Comparing Axon Enterprise, Inc. and Elbit Systems Ltd.
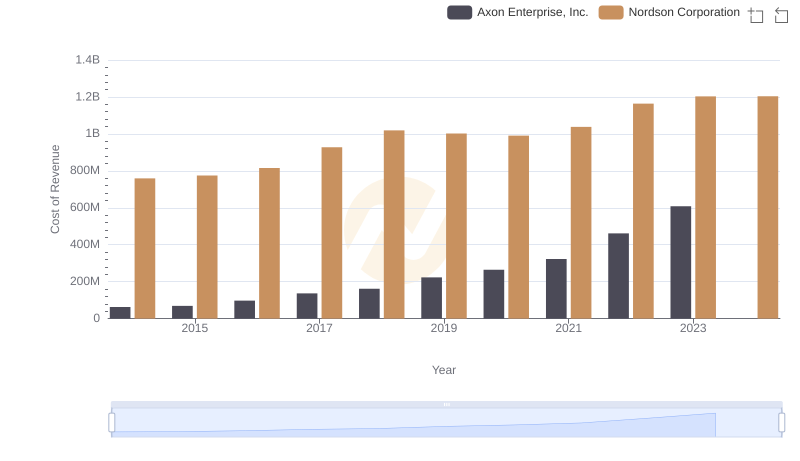
Cost of Revenue Trends: Axon Enterprise, Inc. vs Nordson Corporation
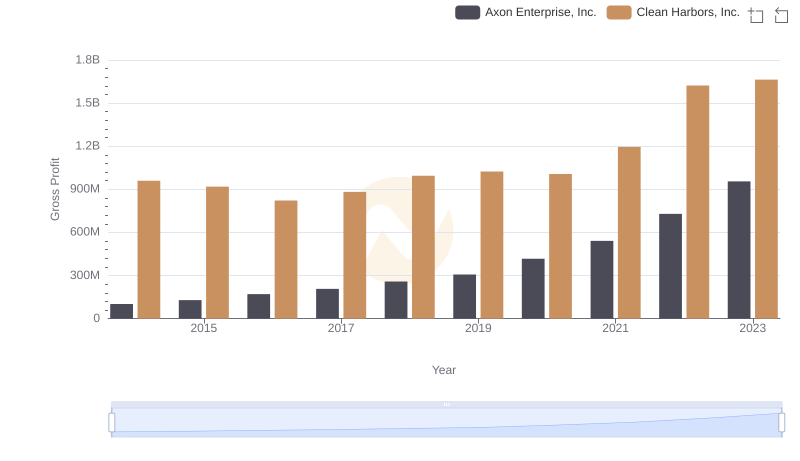
Key Insights on Gross Profit: Axon Enterprise, Inc. vs Clean Harbors, Inc.
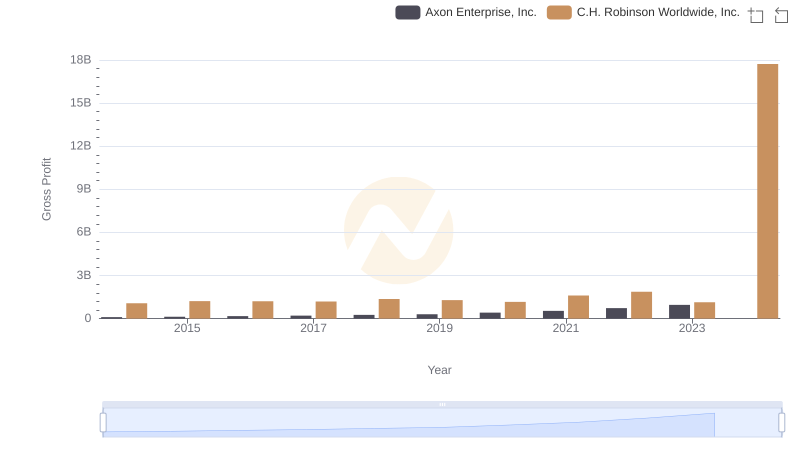
Gross Profit Trends Compared: Axon Enterprise, Inc. vs C.H. Robinson Worldwide, Inc.
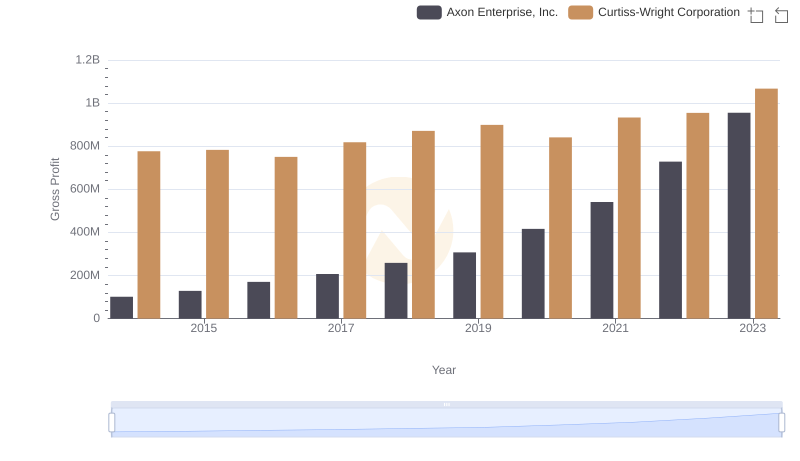
Gross Profit Trends Compared: Axon Enterprise, Inc. vs Curtiss-Wright Corporation
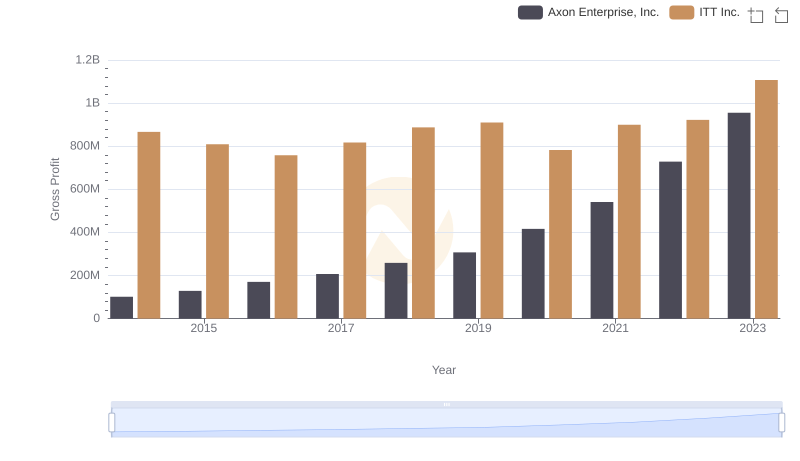
Gross Profit Analysis: Comparing Axon Enterprise, Inc. and ITT Inc.
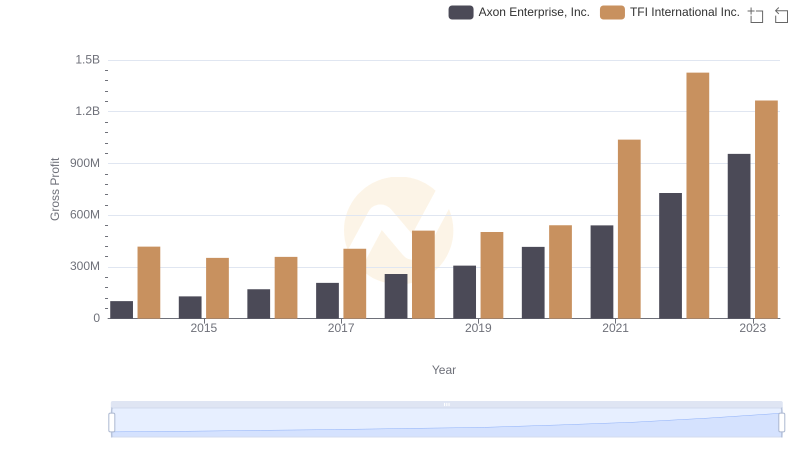
Key Insights on Gross Profit: Axon Enterprise, Inc. vs TFI International Inc.
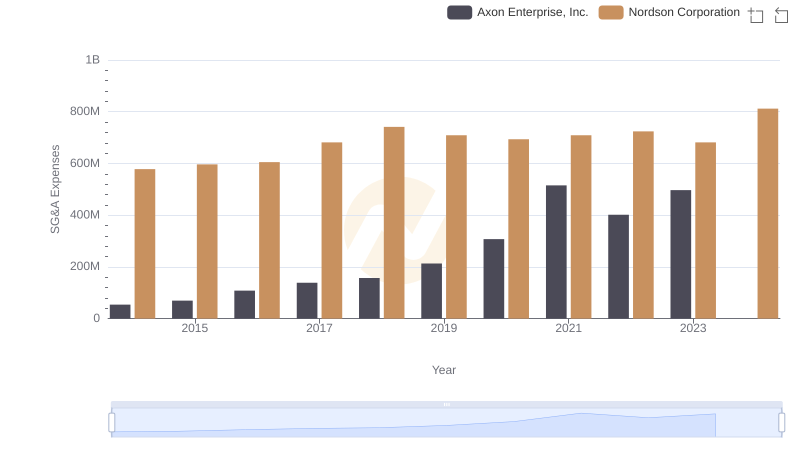
Axon Enterprise, Inc. and Nordson Corporation: SG&A Spending Patterns Compared