| __timestamp | Axon Enterprise, Inc. | Nordson Corporation |
|---|---|---|
| Wednesday, January 1, 2014 | 62977000 | 758923000 |
| Thursday, January 1, 2015 | 69245000 | 774702000 |
| Friday, January 1, 2016 | 97709000 | 815495000 |
| Sunday, January 1, 2017 | 136710000 | 927981000 |
| Monday, January 1, 2018 | 161485000 | 1018703000 |
| Tuesday, January 1, 2019 | 223574000 | 1002123000 |
| Wednesday, January 1, 2020 | 264672000 | 990632000 |
| Friday, January 1, 2021 | 322471000 | 1038129000 |
| Saturday, January 1, 2022 | 461297000 | 1163742000 |
| Sunday, January 1, 2023 | 608009000 | 1203227000 |
| Monday, January 1, 2024 | 1203792000 |
Unleashing insights
In the ever-evolving landscape of industrial technology, understanding cost dynamics is crucial. Over the past decade, Axon Enterprise, Inc. and Nordson Corporation have showcased distinct trajectories in their cost of revenue. From 2014 to 2023, Axon Enterprise, Inc. experienced a staggering increase of nearly 866% in its cost of revenue, reflecting its aggressive growth and expansion strategies. In contrast, Nordson Corporation, a stalwart in the industry, saw a more modest rise of about 58% over the same period, indicating steady growth and operational efficiency.
These trends underscore the diverse strategies employed by these industry leaders, with Axon focusing on rapid expansion and Nordson maintaining steady growth.
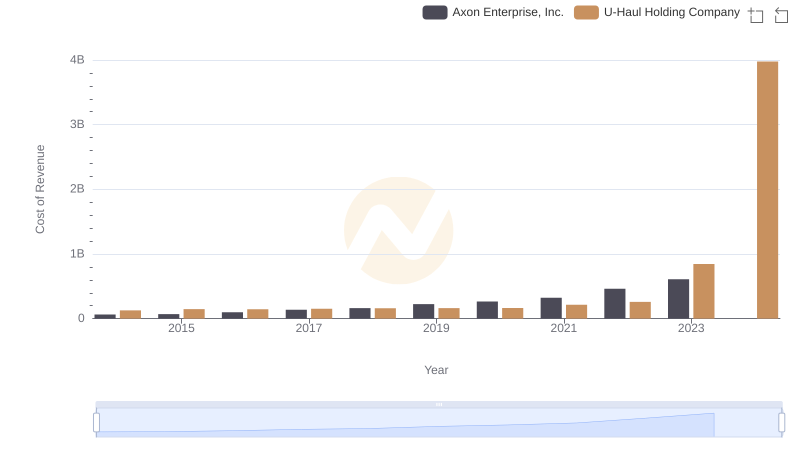
Cost Insights: Breaking Down Axon Enterprise, Inc. and U-Haul Holding Company's Expenses
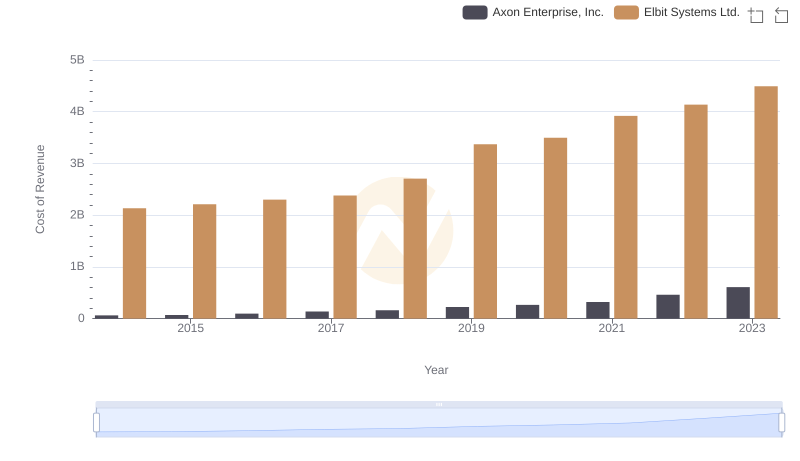
Analyzing Cost of Revenue: Axon Enterprise, Inc. and Elbit Systems Ltd.
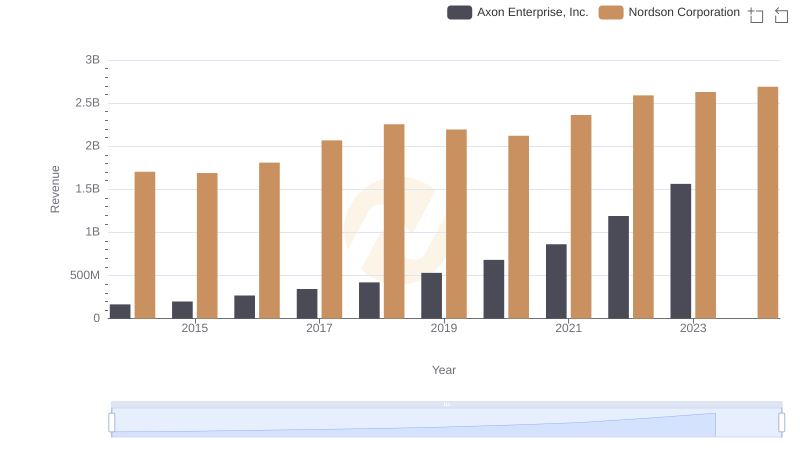
Axon Enterprise, Inc. vs Nordson Corporation: Annual Revenue Growth Compared
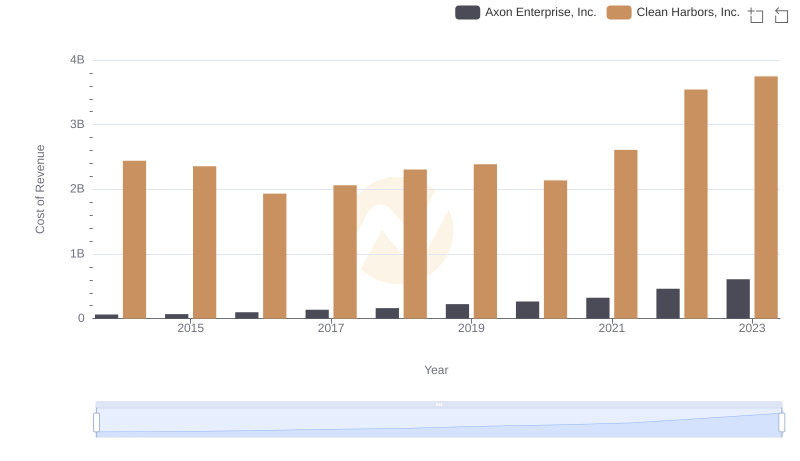
Analyzing Cost of Revenue: Axon Enterprise, Inc. and Clean Harbors, Inc.
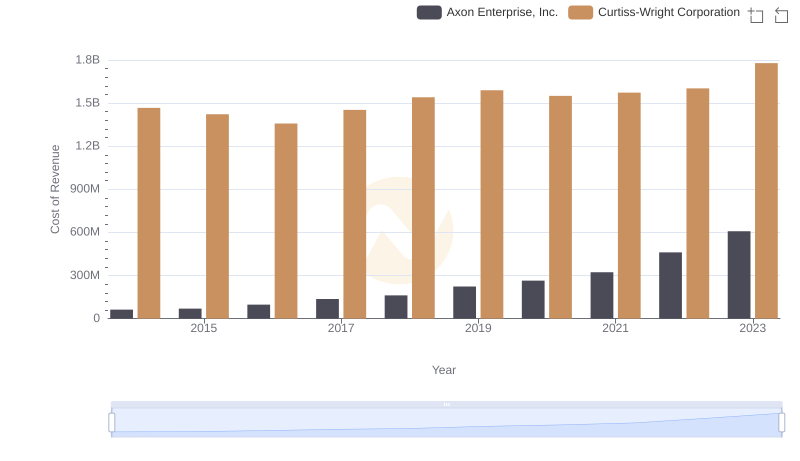
Cost of Revenue Trends: Axon Enterprise, Inc. vs Curtiss-Wright Corporation
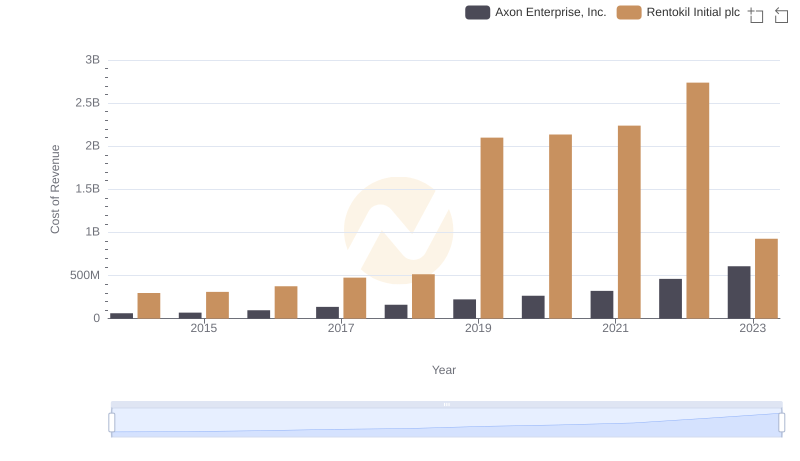
Axon Enterprise, Inc. vs Rentokil Initial plc: Efficiency in Cost of Revenue Explored
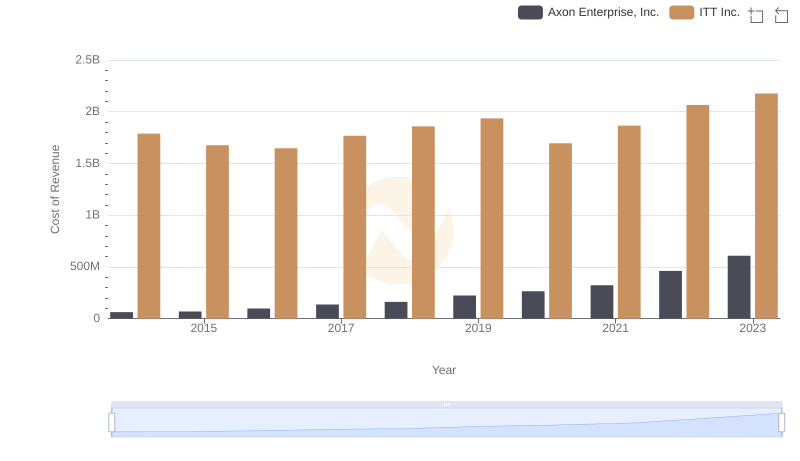
Analyzing Cost of Revenue: Axon Enterprise, Inc. and ITT Inc.
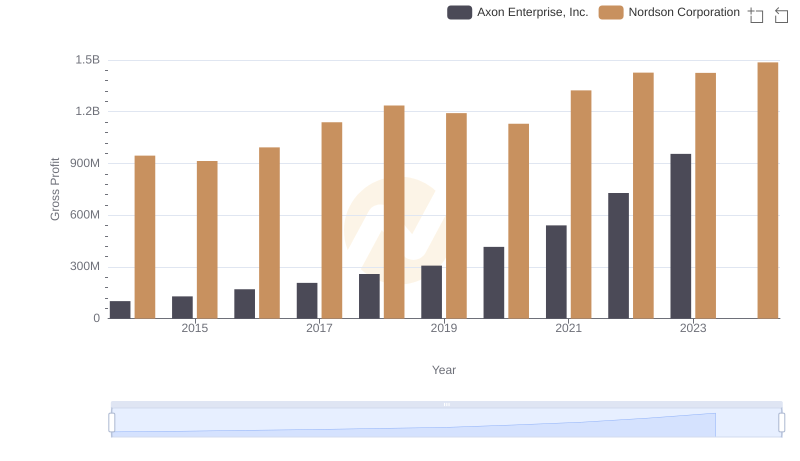
Axon Enterprise, Inc. vs Nordson Corporation: A Gross Profit Performance Breakdown
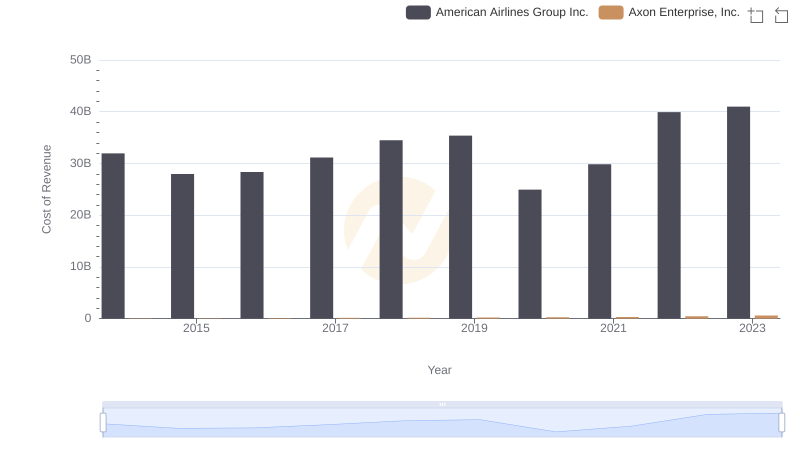
Cost Insights: Breaking Down Axon Enterprise, Inc. and American Airlines Group Inc.'s Expenses
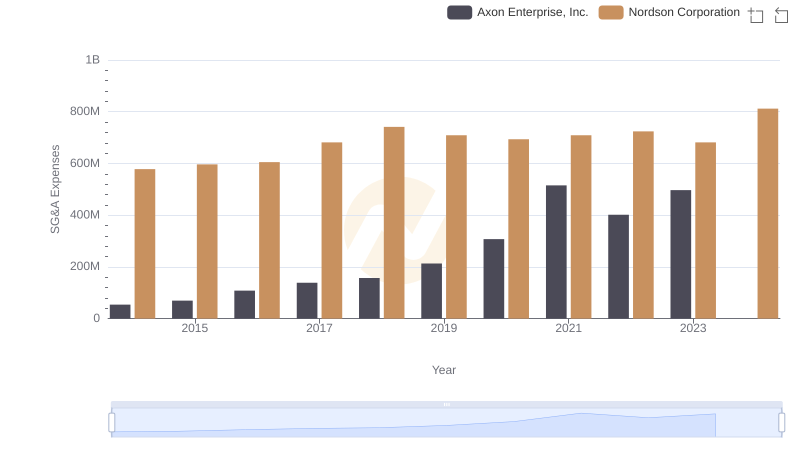
Axon Enterprise, Inc. and Nordson Corporation: SG&A Spending Patterns Compared