| __timestamp | Axon Enterprise, Inc. | Rentokil Initial plc |
|---|---|---|
| Wednesday, January 1, 2014 | 54158000 | 935700000 |
| Thursday, January 1, 2015 | 69698000 | 965700000 |
| Friday, January 1, 2016 | 108076000 | 1197600000 |
| Sunday, January 1, 2017 | 138692000 | 1329600000 |
| Monday, January 1, 2018 | 156886000 | 1364000000 |
| Tuesday, January 1, 2019 | 212959000 | 322500000 |
| Wednesday, January 1, 2020 | 307286000 | 352000000 |
| Friday, January 1, 2021 | 515007000 | 348600000 |
| Saturday, January 1, 2022 | 401575000 | 479000000 |
| Sunday, January 1, 2023 | 496874000 | 2870000000 |
Infusing magic into the data realm
In the ever-evolving landscape of corporate finance, understanding the trends in Selling, General, and Administrative (SG&A) expenses is crucial for investors and analysts alike. Over the past decade, Axon Enterprise, Inc. and Rentokil Initial plc have showcased contrasting trajectories in their SG&A expenditures.
From 2014 to 2023, Axon Enterprise, Inc. saw a staggering increase of over 800% in SG&A expenses, reflecting its aggressive growth strategy and expansion efforts. In contrast, Rentokil Initial plc experienced a more modest 200% rise, with a notable spike in 2023, indicating strategic investments or restructuring.
While Axon's expenses peaked in 2021, Rentokil's significant jump in 2023 suggests a pivotal year for the company. These trends highlight the dynamic nature of business strategies and their impact on financial health.
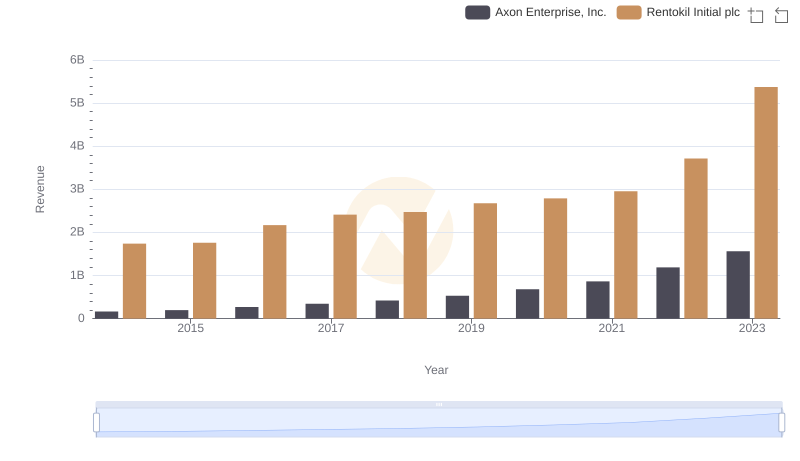
Who Generates More Revenue? Axon Enterprise, Inc. or Rentokil Initial plc
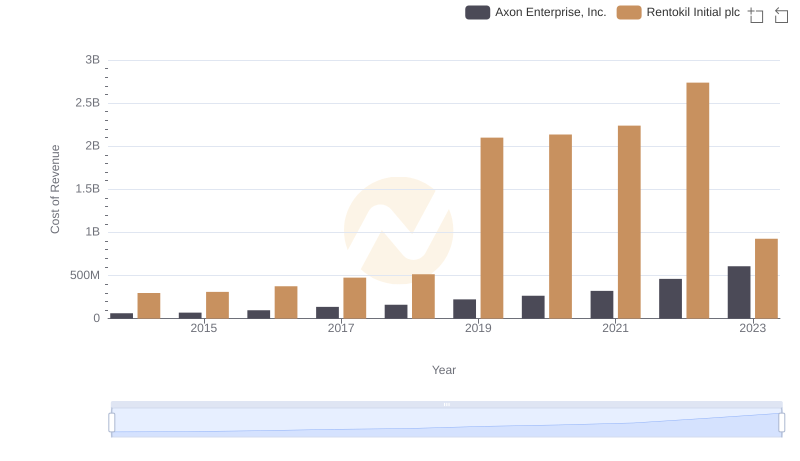
Axon Enterprise, Inc. vs Rentokil Initial plc: Efficiency in Cost of Revenue Explored
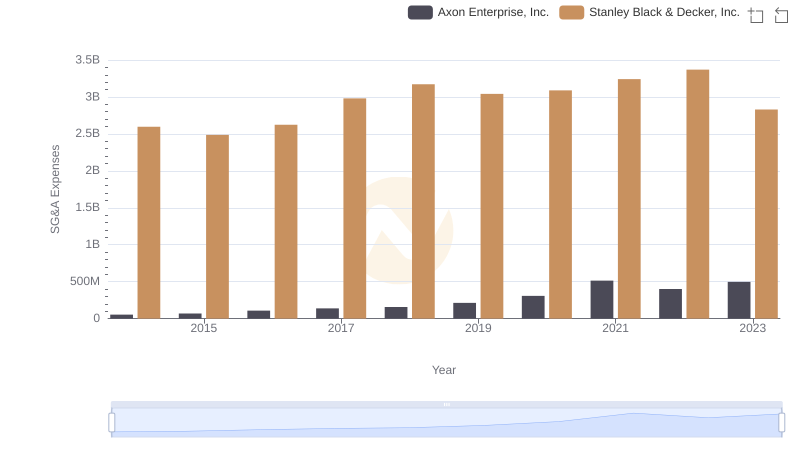
Axon Enterprise, Inc. vs Stanley Black & Decker, Inc.: SG&A Expense Trends
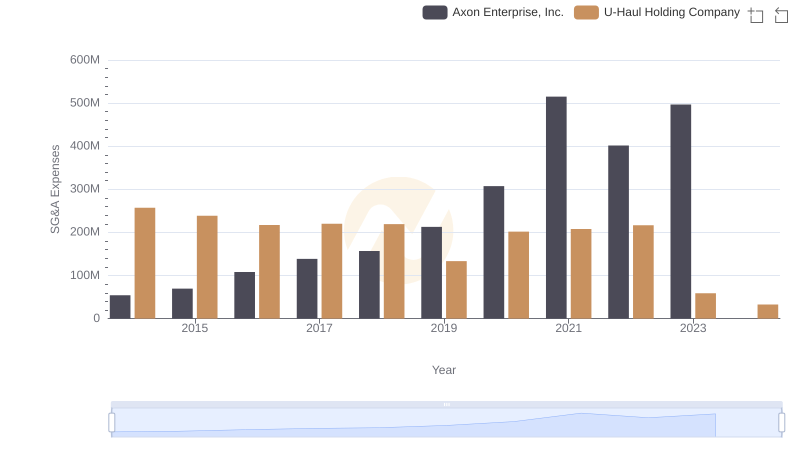
Cost Management Insights: SG&A Expenses for Axon Enterprise, Inc. and U-Haul Holding Company
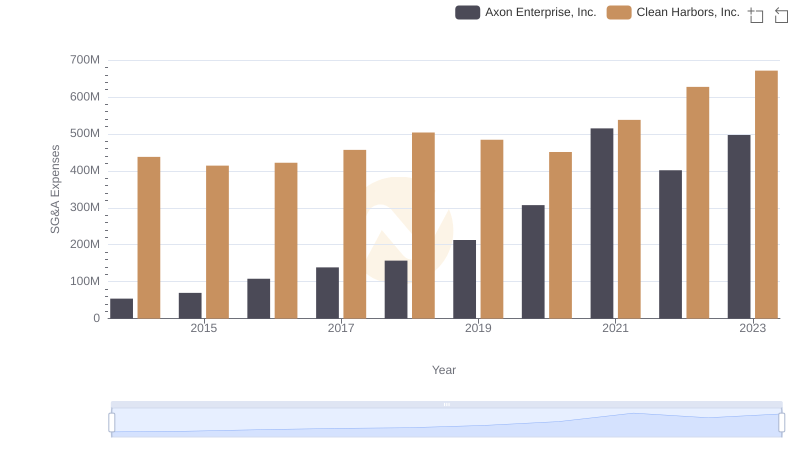
Comparing SG&A Expenses: Axon Enterprise, Inc. vs Clean Harbors, Inc. Trends and Insights
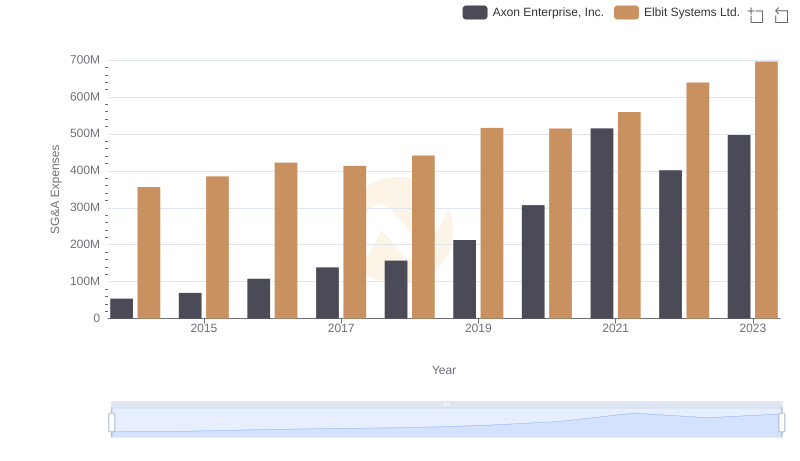
Comparing SG&A Expenses: Axon Enterprise, Inc. vs Elbit Systems Ltd. Trends and Insights
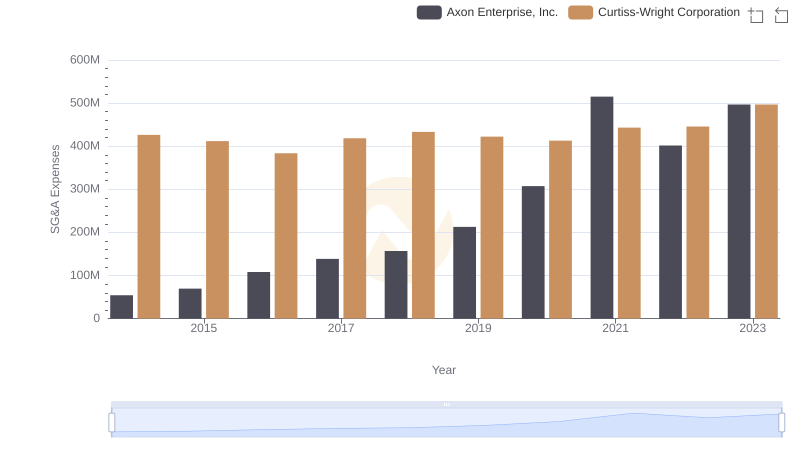
Comparing SG&A Expenses: Axon Enterprise, Inc. vs Curtiss-Wright Corporation Trends and Insights
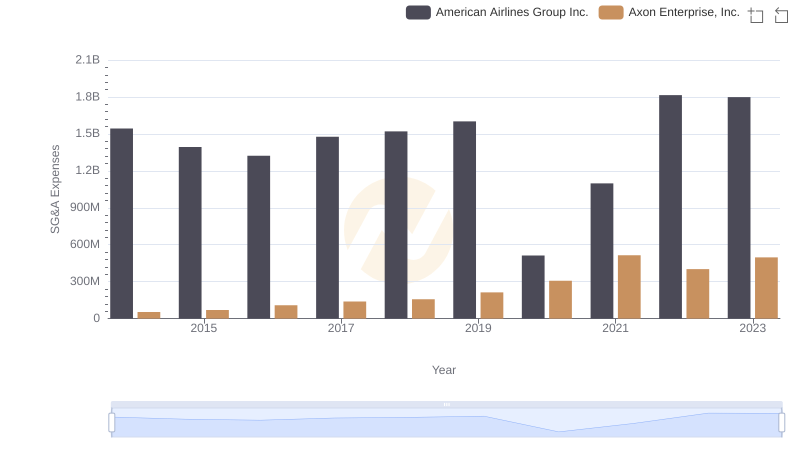
Who Optimizes SG&A Costs Better? Axon Enterprise, Inc. or American Airlines Group Inc.
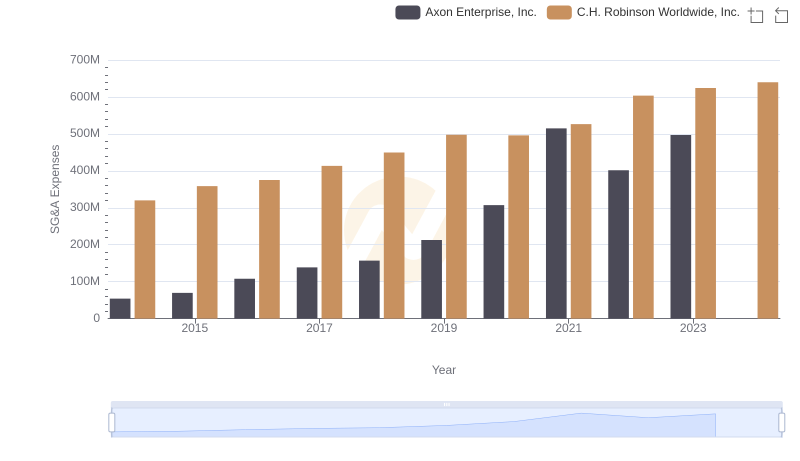
Axon Enterprise, Inc. vs C.H. Robinson Worldwide, Inc.: SG&A Expense Trends
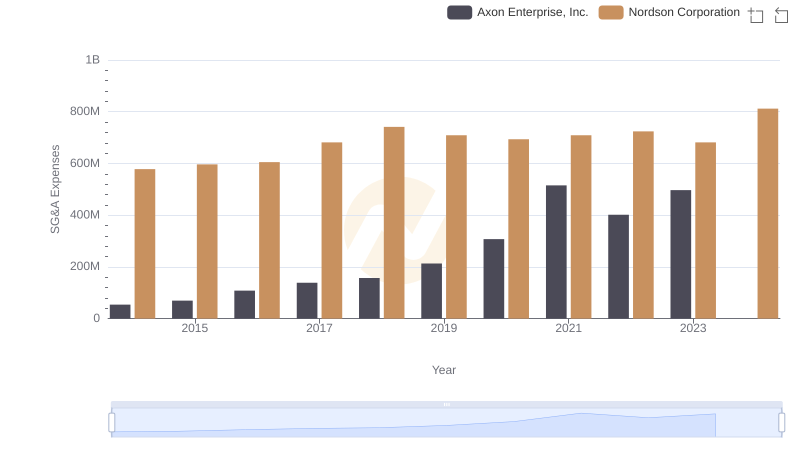
Axon Enterprise, Inc. and Nordson Corporation: SG&A Spending Patterns Compared
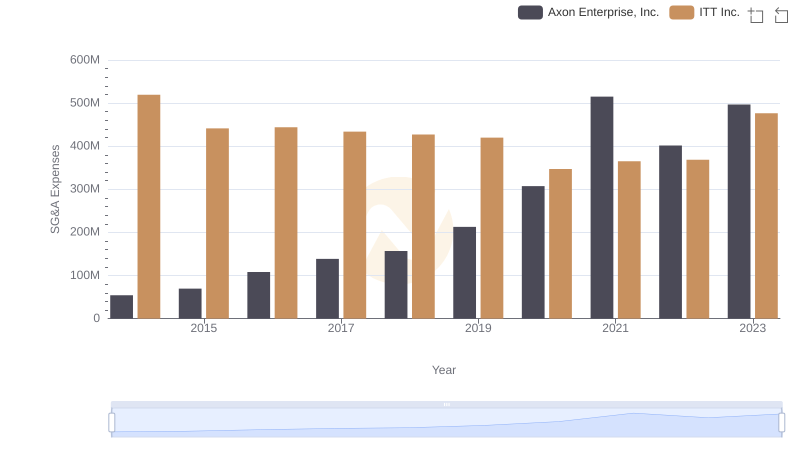
Axon Enterprise, Inc. vs ITT Inc.: SG&A Expense Trends