| __timestamp | Allegion plc | Lennox International Inc. |
|---|---|---|
| Wednesday, January 1, 2014 | 43300000 | 60700000 |
| Thursday, January 1, 2015 | 45200000 | 62300000 |
| Friday, January 1, 2016 | 47300000 | 64599999 |
| Sunday, January 1, 2017 | 48300000 | 73600000 |
| Monday, January 1, 2018 | 54400000 | 72200000 |
| Tuesday, January 1, 2019 | 54700000 | 69900000 |
| Wednesday, January 1, 2020 | 54400000 | 66800000 |
| Friday, January 1, 2021 | 73300000 | 76100000 |
| Saturday, January 1, 2022 | 74500000 | 80300000 |
| Sunday, January 1, 2023 | 101900000 | 94000000 |
| Monday, January 1, 2024 | 0 | 0 |
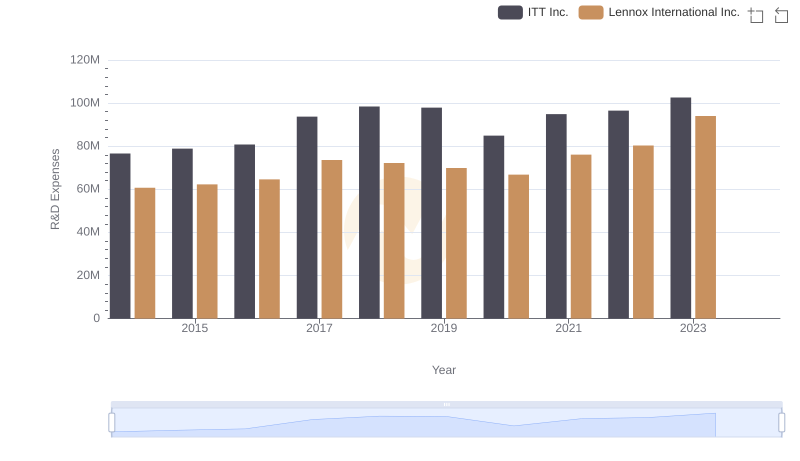
Unveiling the hidden dimensions of data
In the ever-evolving landscape of industrial innovation, research and development (R&D) play a pivotal role. Over the past decade, Lennox International Inc. and Allegion plc have demonstrated distinct trajectories in their R&D investments. From 2014 to 2023, Lennox International Inc. consistently allocated a significant portion of its resources to R&D, peaking in 2023 with an impressive 54% increase from 2014. Allegion plc, on the other hand, showcased a remarkable surge in 2023, with R&D expenses nearly doubling compared to 2014, highlighting a strategic pivot towards innovation.
While Lennox International Inc. maintained a steady growth, Allegion plc's recent leap underscores a potential shift in market strategy. This data not only reflects the companies' commitment to innovation but also offers insights into their future directions. As we look forward, the absence of 2024 data leaves room for speculation on how these trends will evolve.
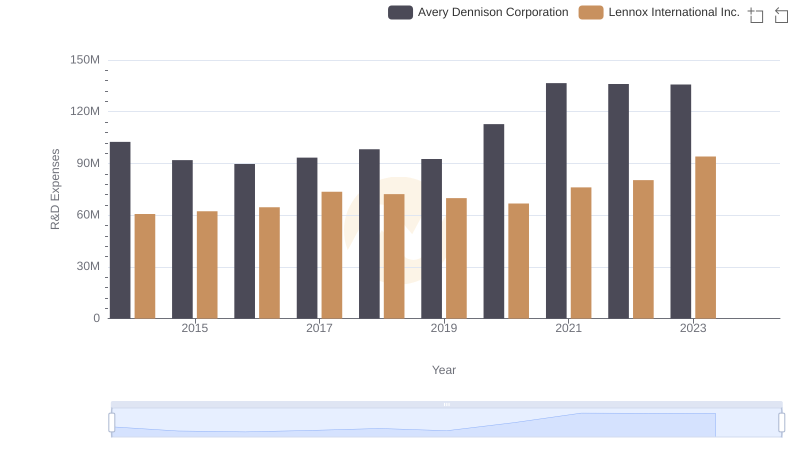
Lennox International Inc. or Avery Dennison Corporation: Who Invests More in Innovation?
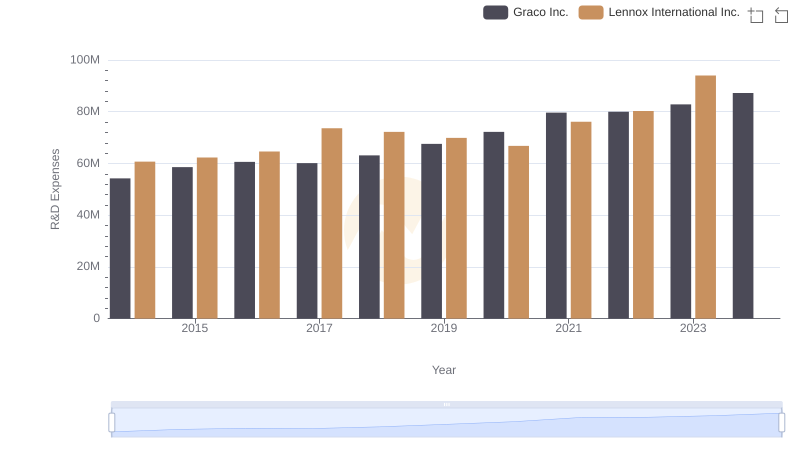
Lennox International Inc. or Graco Inc.: Who Invests More in Innovation?
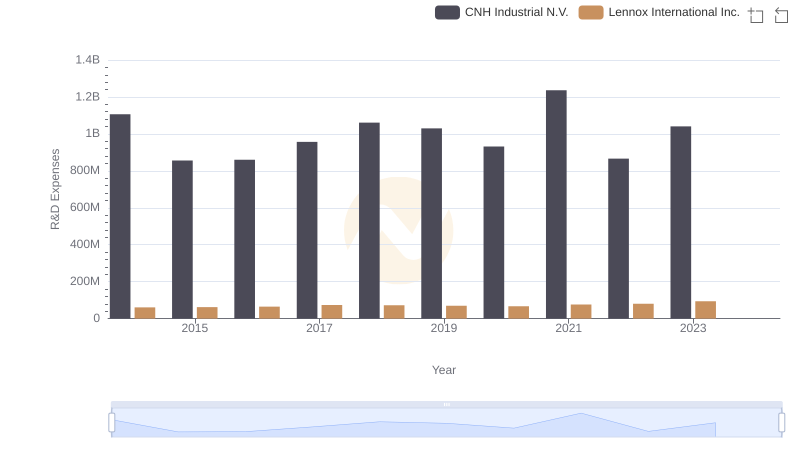
Comparing Innovation Spending: Lennox International Inc. and CNH Industrial N.V.
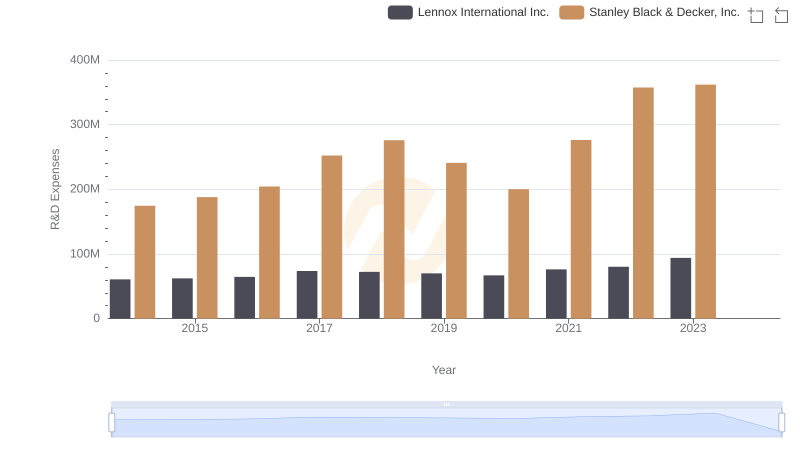
Research and Development: Comparing Key Metrics for Lennox International Inc. and Stanley Black & Decker, Inc.
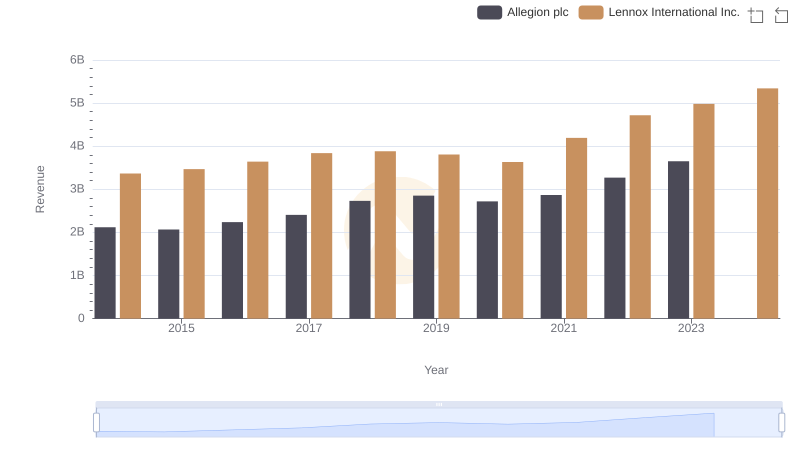
Annual Revenue Comparison: Lennox International Inc. vs Allegion plc
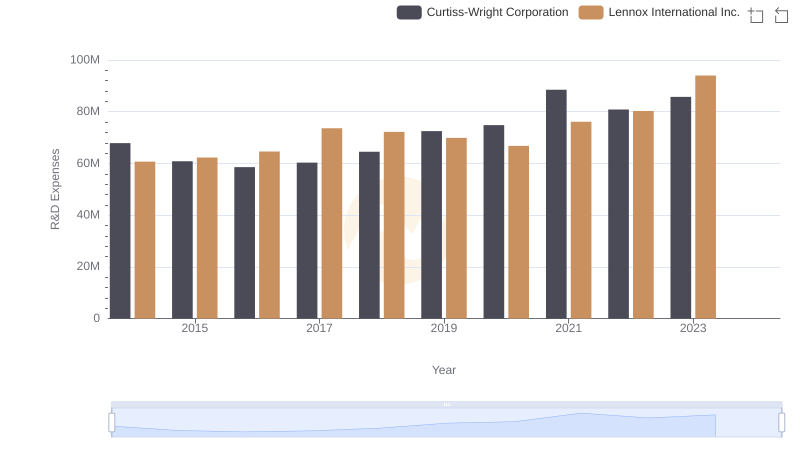
Research and Development Investment: Lennox International Inc. vs Curtiss-Wright Corporation
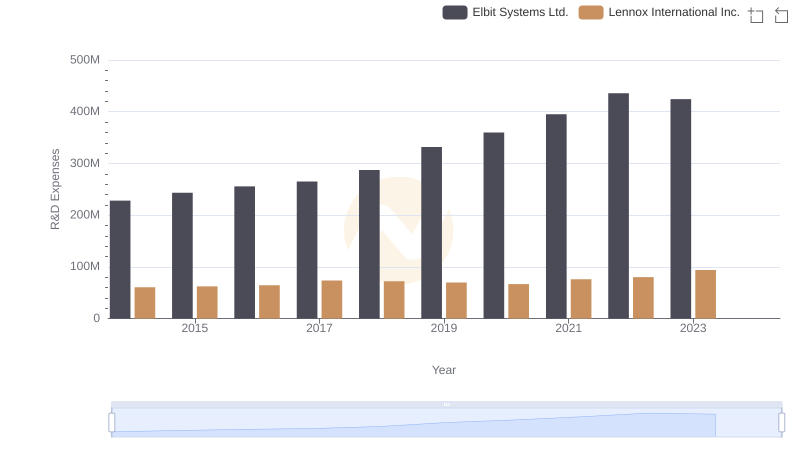
Lennox International Inc. vs Elbit Systems Ltd.: Strategic Focus on R&D Spending
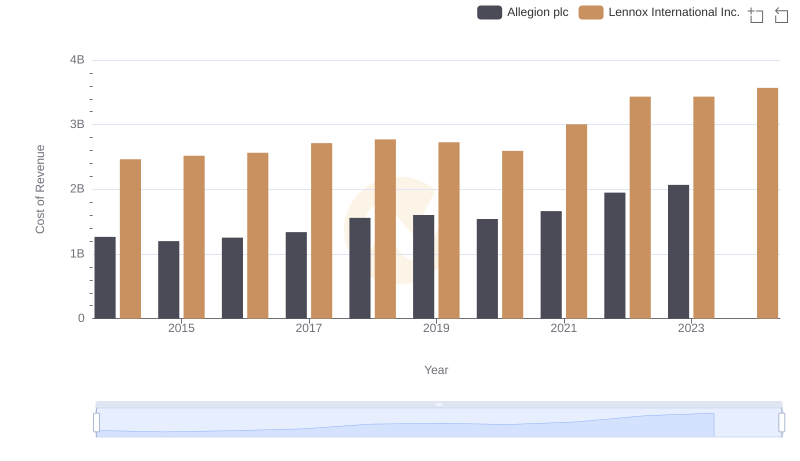
Analyzing Cost of Revenue: Lennox International Inc. and Allegion plc
Lennox International Inc. or ITT Inc.: Who Invests More in Innovation?
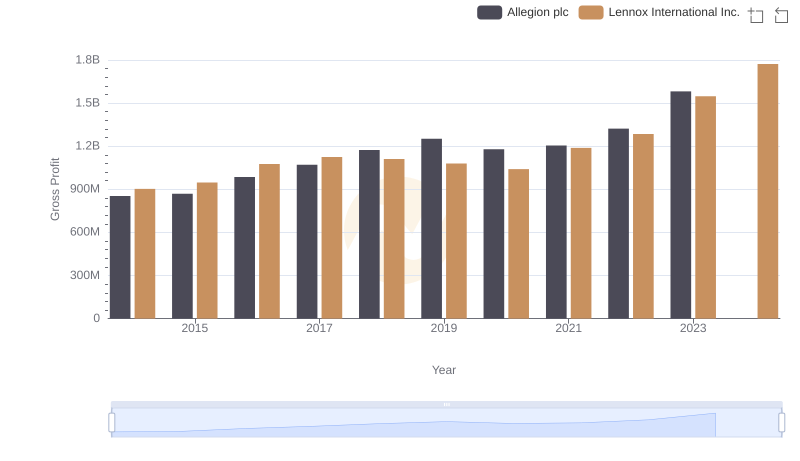
Key Insights on Gross Profit: Lennox International Inc. vs Allegion plc
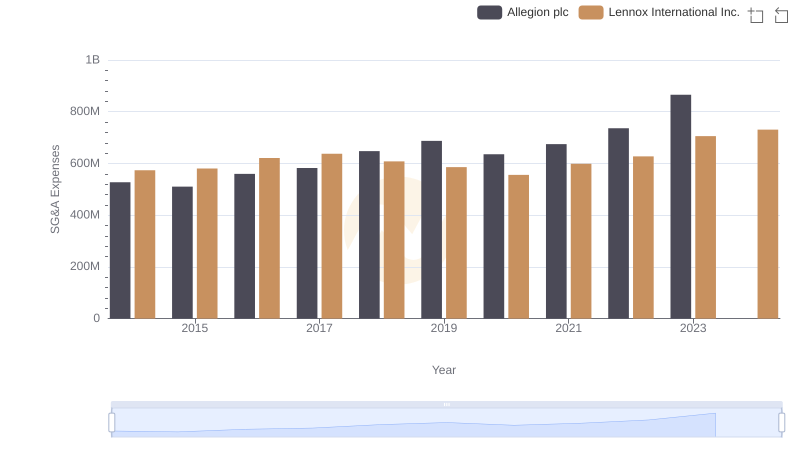
Who Optimizes SG&A Costs Better? Lennox International Inc. or Allegion plc
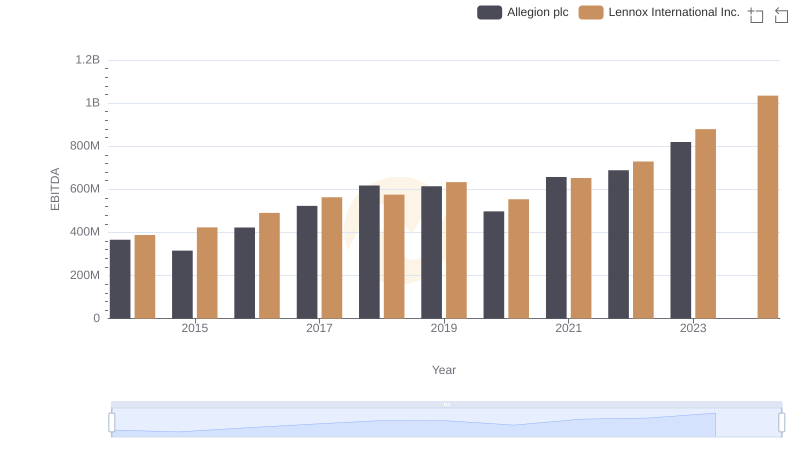
Professional EBITDA Benchmarking: Lennox International Inc. vs Allegion plc