| __timestamp | Allegion plc | Lennox International Inc. |
|---|---|---|
| Wednesday, January 1, 2014 | 527400000 | 573700000 |
| Thursday, January 1, 2015 | 510500000 | 580500000 |
| Friday, January 1, 2016 | 559800000 | 621000000 |
| Sunday, January 1, 2017 | 582500000 | 637700000 |
| Monday, January 1, 2018 | 647500000 | 608200000 |
| Tuesday, January 1, 2019 | 687200000 | 585900000 |
| Wednesday, January 1, 2020 | 635700000 | 555900000 |
| Friday, January 1, 2021 | 674700000 | 598900000 |
| Saturday, January 1, 2022 | 736000000 | 627200000 |
| Sunday, January 1, 2023 | 865600000 | 705500000 |
| Monday, January 1, 2024 | 887800000 | 730600000 |
Data in motion
In the competitive landscape of corporate finance, optimizing Selling, General, and Administrative (SG&A) expenses is crucial for maintaining profitability. This analysis delves into the SG&A cost management strategies of Lennox International Inc. and Allegion plc over the past decade.
From 2014 to 2023, Allegion plc demonstrated a steady increase in SG&A expenses, peaking at approximately 866 million in 2023, marking a 64% rise from 2014. In contrast, Lennox International Inc. showed a more conservative approach, with expenses fluctuating but ultimately increasing by about 23% over the same period, reaching around 706 million in 2023.
While Allegion's aggressive growth strategy is evident, Lennox's more stable expense management suggests a focus on efficiency. Missing data for 2024 indicates potential shifts in strategy or reporting. This comparative analysis highlights the diverse approaches companies take in managing operational costs, offering valuable insights for investors and financial analysts.
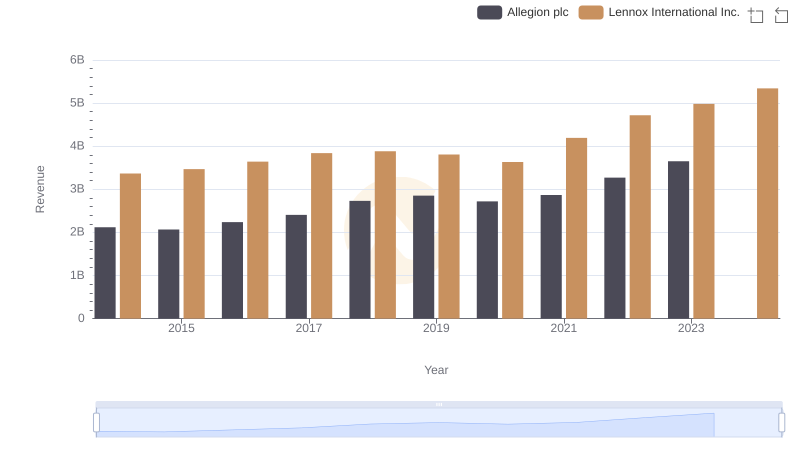
Annual Revenue Comparison: Lennox International Inc. vs Allegion plc
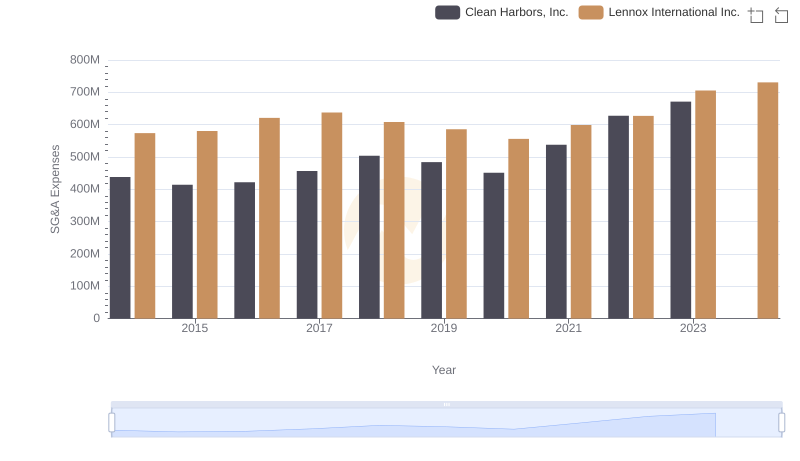
Lennox International Inc. and Clean Harbors, Inc.: SG&A Spending Patterns Compared
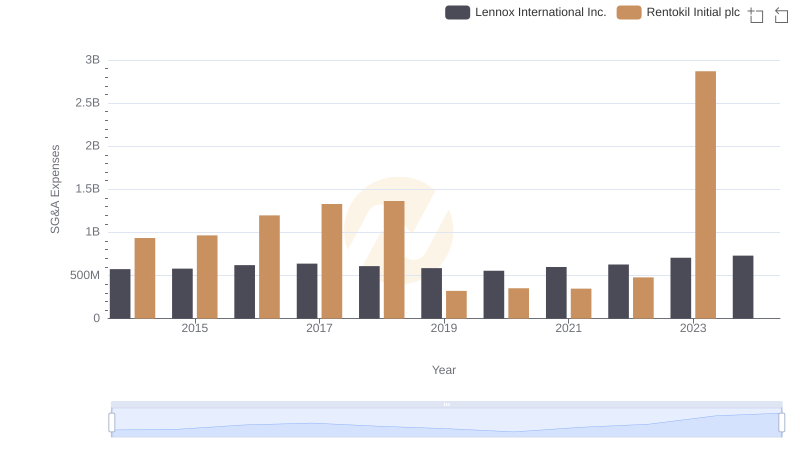
Who Optimizes SG&A Costs Better? Lennox International Inc. or Rentokil Initial plc
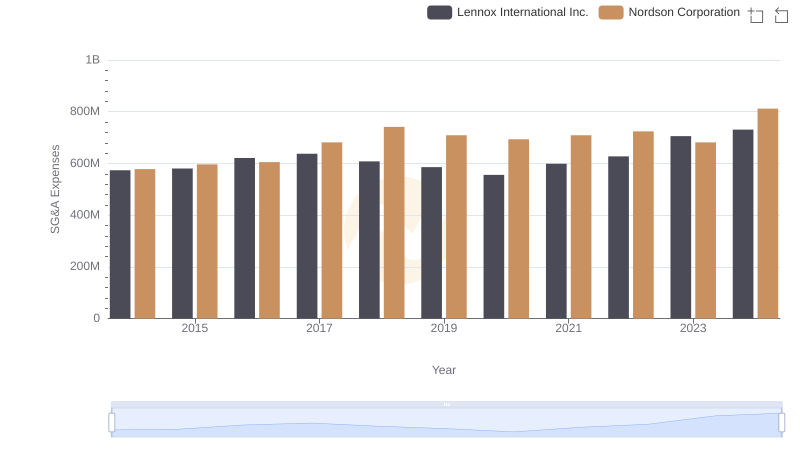
Breaking Down SG&A Expenses: Lennox International Inc. vs Nordson Corporation
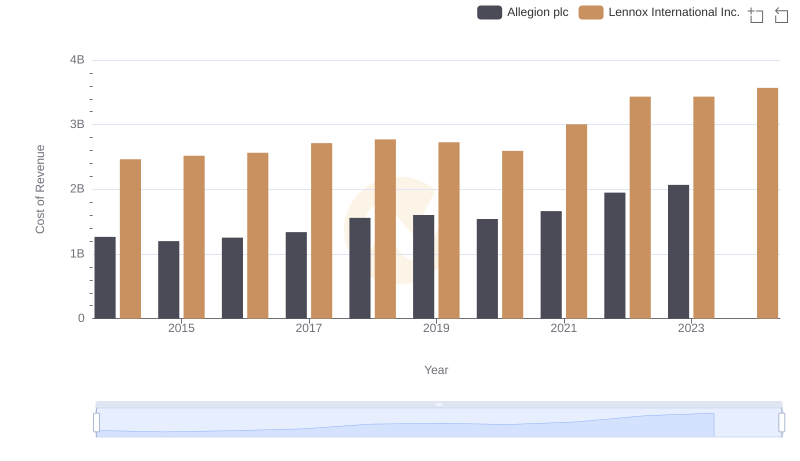
Analyzing Cost of Revenue: Lennox International Inc. and Allegion plc
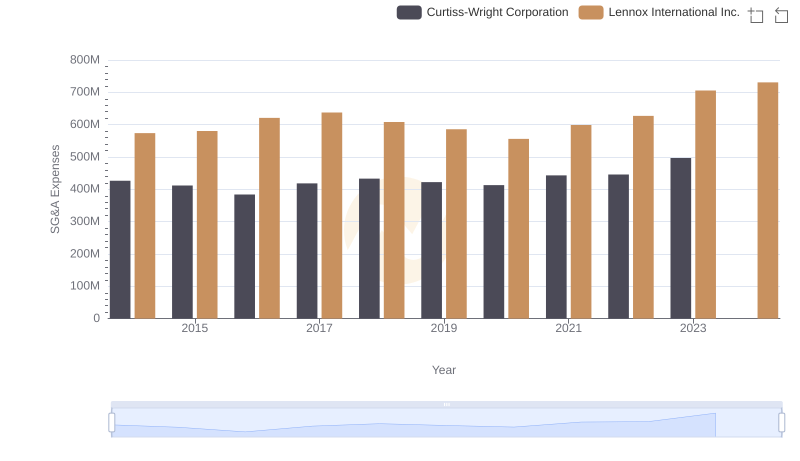
SG&A Efficiency Analysis: Comparing Lennox International Inc. and Curtiss-Wright Corporation
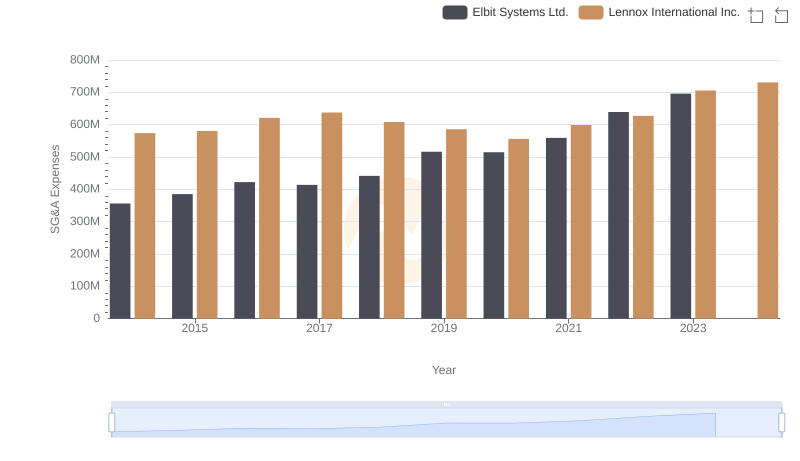
Comparing SG&A Expenses: Lennox International Inc. vs Elbit Systems Ltd. Trends and Insights
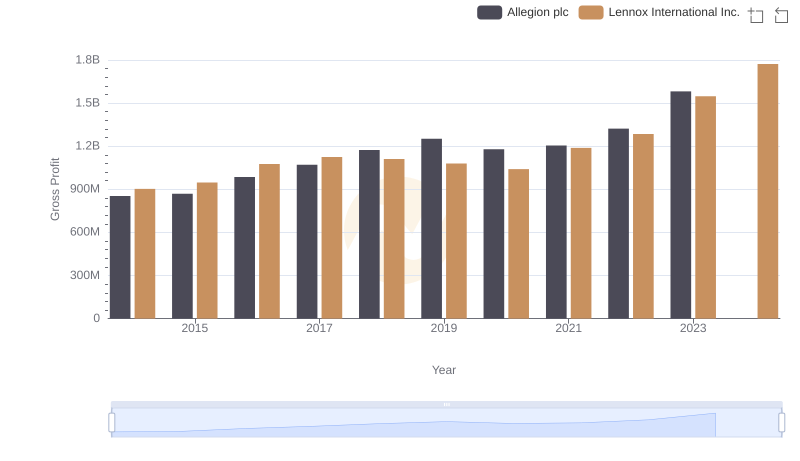
Key Insights on Gross Profit: Lennox International Inc. vs Allegion plc
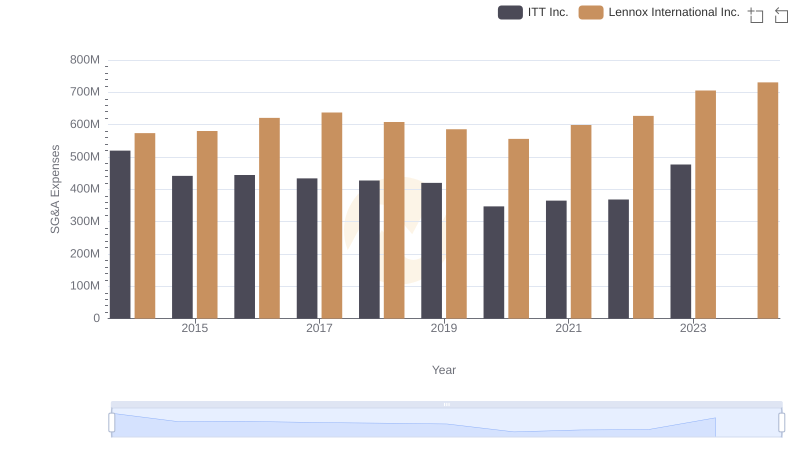
Who Optimizes SG&A Costs Better? Lennox International Inc. or ITT Inc.
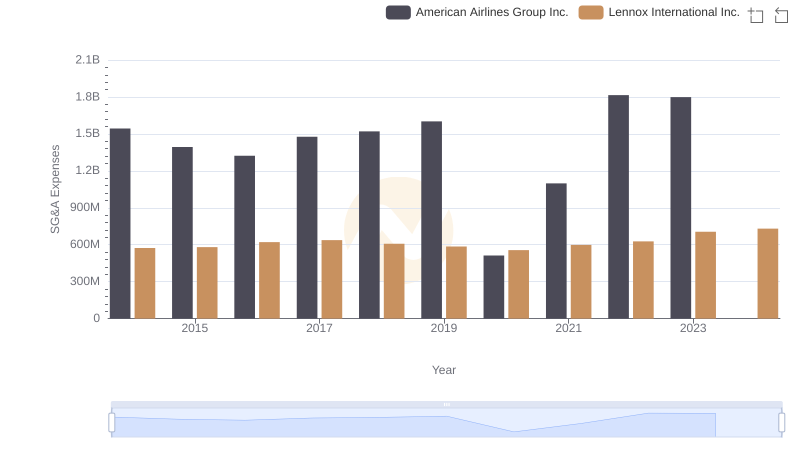
Lennox International Inc. and American Airlines Group Inc.: SG&A Spending Patterns Compared
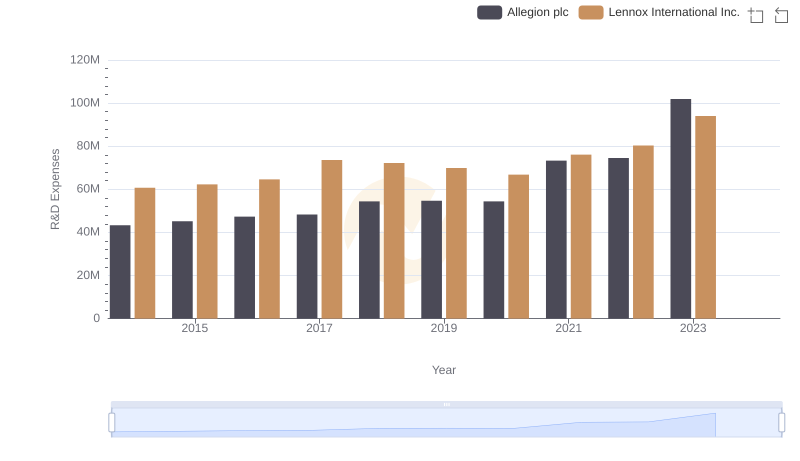
Research and Development: Comparing Key Metrics for Lennox International Inc. and Allegion plc
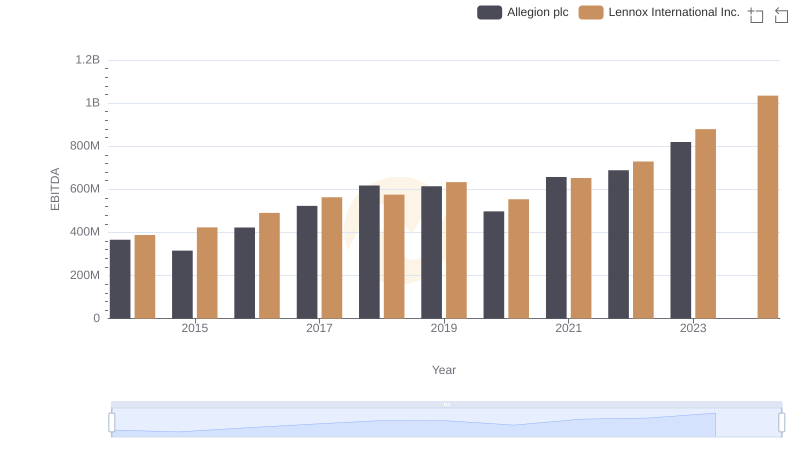
Professional EBITDA Benchmarking: Lennox International Inc. vs Allegion plc