| __timestamp | International Business Machines Corporation | Texas Instruments Incorporated |
|---|---|---|
| Wednesday, January 1, 2014 | 92793000000 | 13045000000 |
| Thursday, January 1, 2015 | 81742000000 | 13000000000 |
| Friday, January 1, 2016 | 79920000000 | 13370000000 |
| Sunday, January 1, 2017 | 79139000000 | 14961000000 |
| Monday, January 1, 2018 | 79591000000 | 15784000000 |
| Tuesday, January 1, 2019 | 57714000000 | 14383000000 |
| Wednesday, January 1, 2020 | 55179000000 | 14461000000 |
| Friday, January 1, 2021 | 57351000000 | 18344000000 |
| Saturday, January 1, 2022 | 60530000000 | 20028000000 |
| Sunday, January 1, 2023 | 61860000000 | 17519000000 |
| Monday, January 1, 2024 | 62753000000 | 15641000000 |
Unleashing insights
In the ever-evolving landscape of technology, two titans, International Business Machines Corporation (IBM) and Texas Instruments Incorporated (TI), have consistently shaped the industry. From 2014 to 2024, IBM's annual revenue has seen a decline of approximately 32%, from $92.8 billion to $62.8 billion. This trend reflects IBM's strategic shift towards cloud computing and AI, moving away from traditional hardware.
Conversely, Texas Instruments has experienced a revenue growth of around 20% over the same period, peaking at $20 billion in 2022. This growth underscores TI's robust position in the semiconductor market, driven by demand in automotive and industrial sectors.
While IBM's revenue trajectory highlights its transformative journey, TI's steady climb showcases its resilience and adaptability. As these companies continue to innovate, their financial narratives offer valuable insights into the broader tech industry's dynamics.
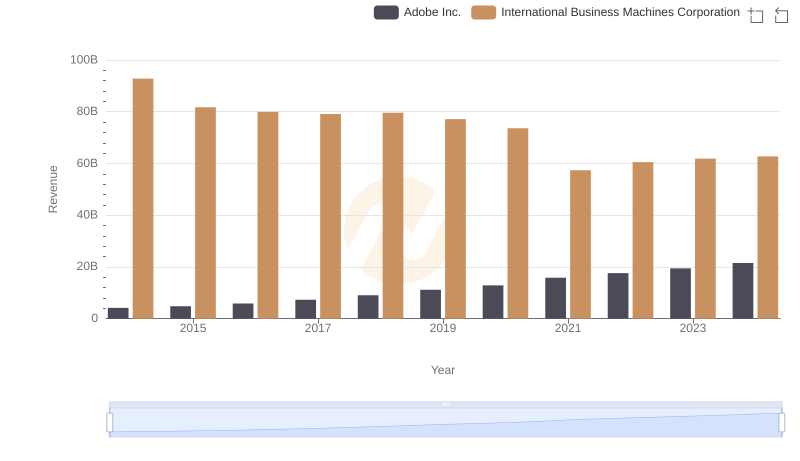
Who Generates More Revenue? International Business Machines Corporation or Adobe Inc.
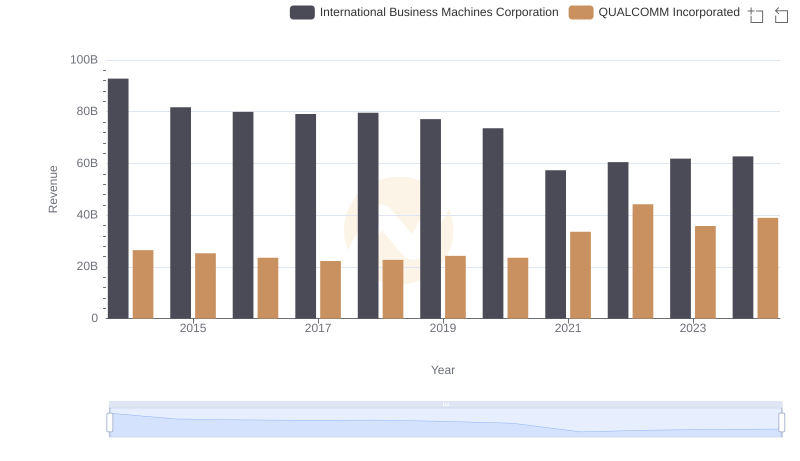
Comparing Revenue Performance: International Business Machines Corporation or QUALCOMM Incorporated?
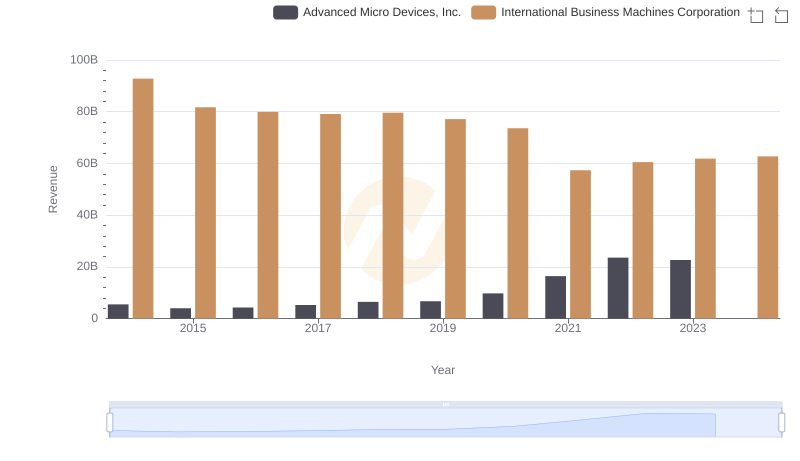
Breaking Down Revenue Trends: International Business Machines Corporation vs Advanced Micro Devices, Inc.
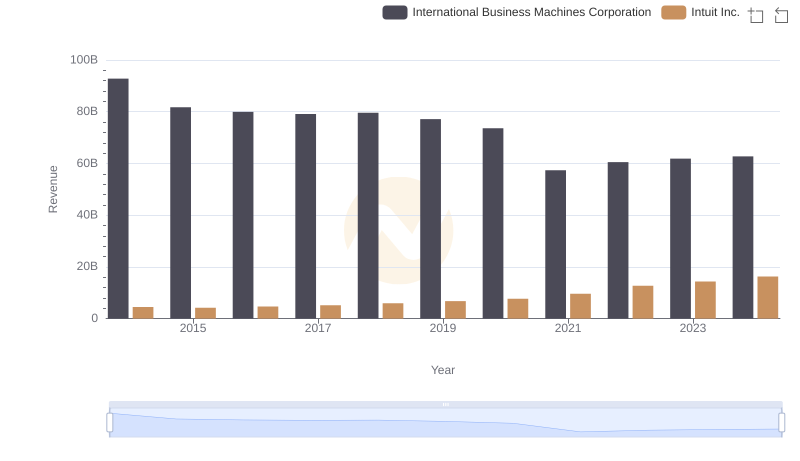
Annual Revenue Comparison: International Business Machines Corporation vs Intuit Inc.
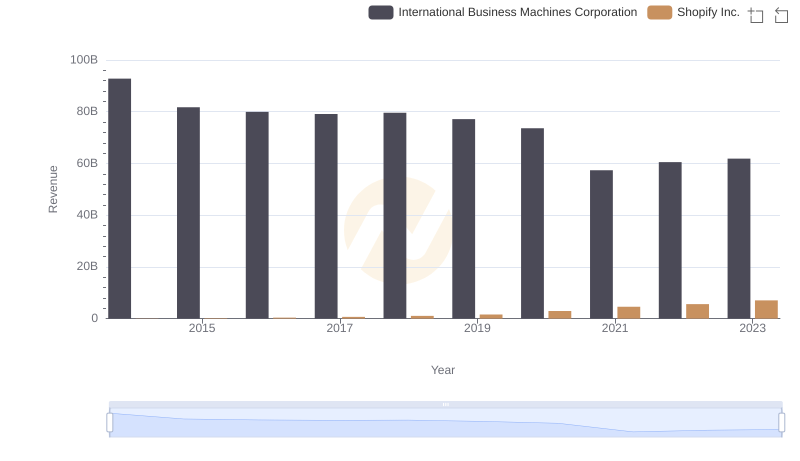
Comparing Revenue Performance: International Business Machines Corporation or Shopify Inc.?
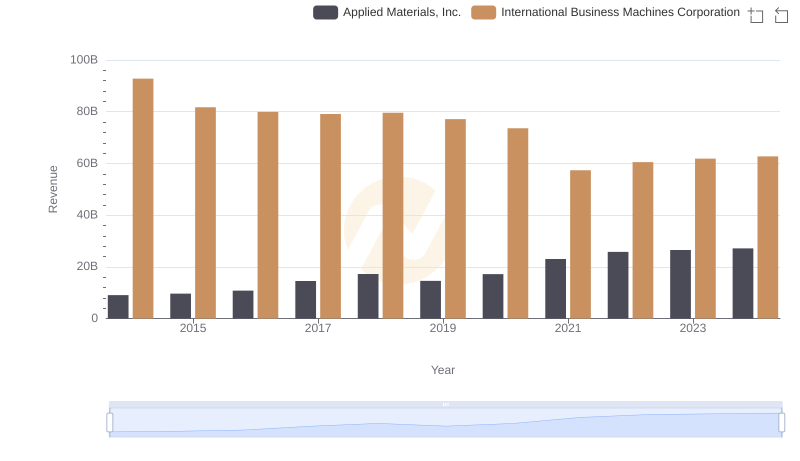
Comparing Revenue Performance: International Business Machines Corporation or Applied Materials, Inc.?
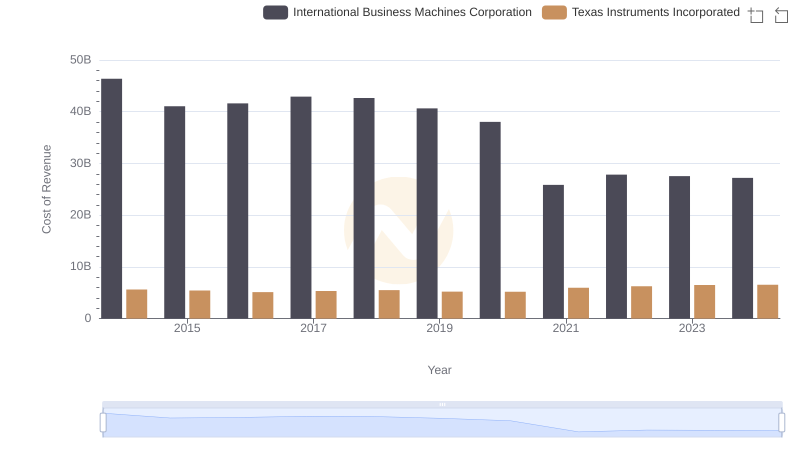
Cost Insights: Breaking Down International Business Machines Corporation and Texas Instruments Incorporated's Expenses
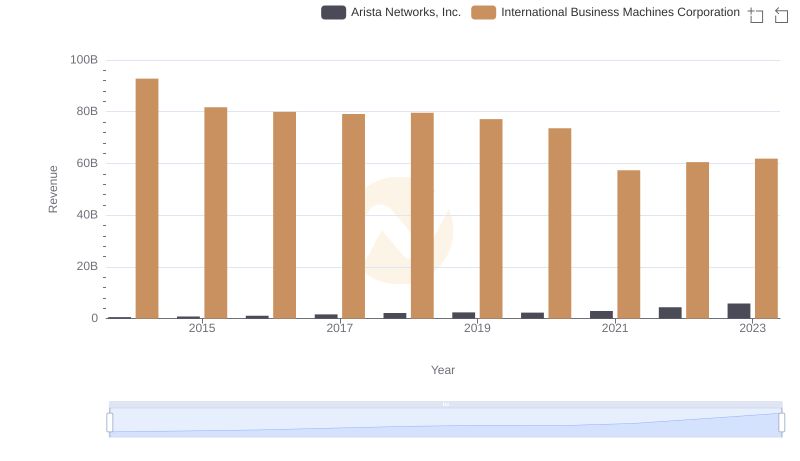
Annual Revenue Comparison: International Business Machines Corporation vs Arista Networks, Inc.
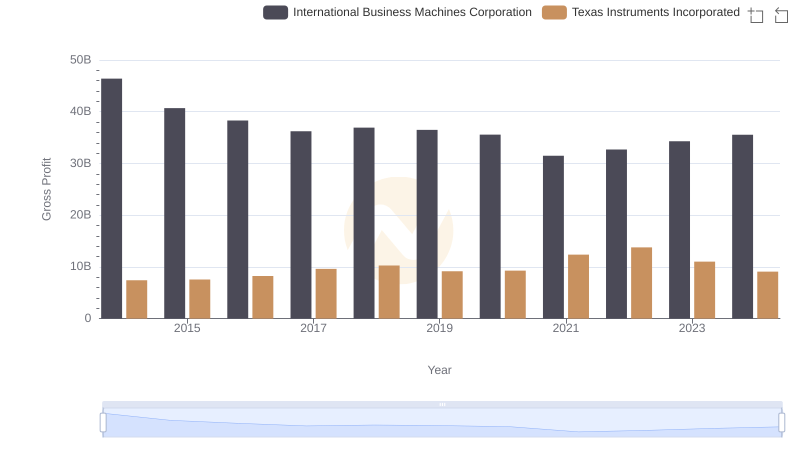
Gross Profit Comparison: International Business Machines Corporation and Texas Instruments Incorporated Trends
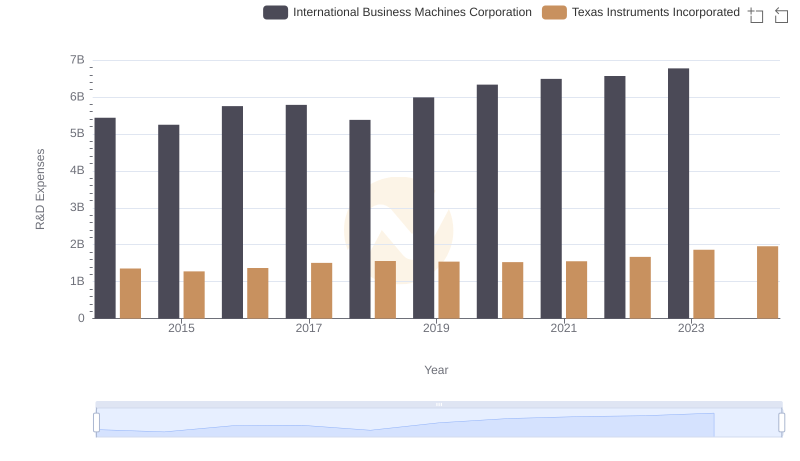
R&D Spending Showdown: International Business Machines Corporation vs Texas Instruments Incorporated
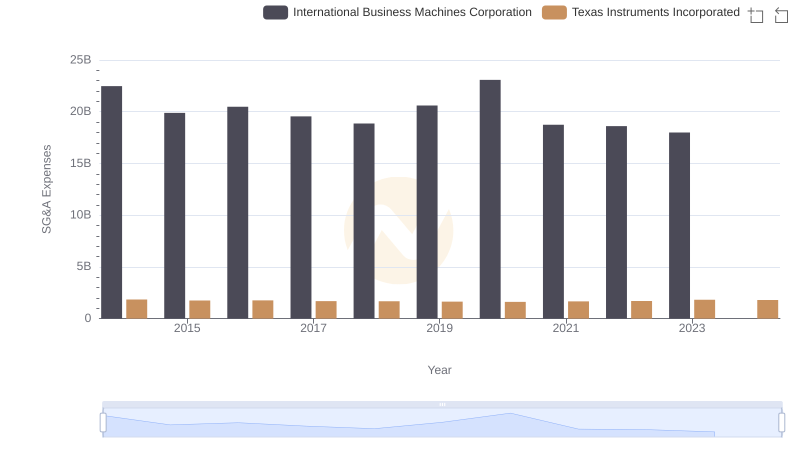
International Business Machines Corporation or Texas Instruments Incorporated: Who Manages SG&A Costs Better?
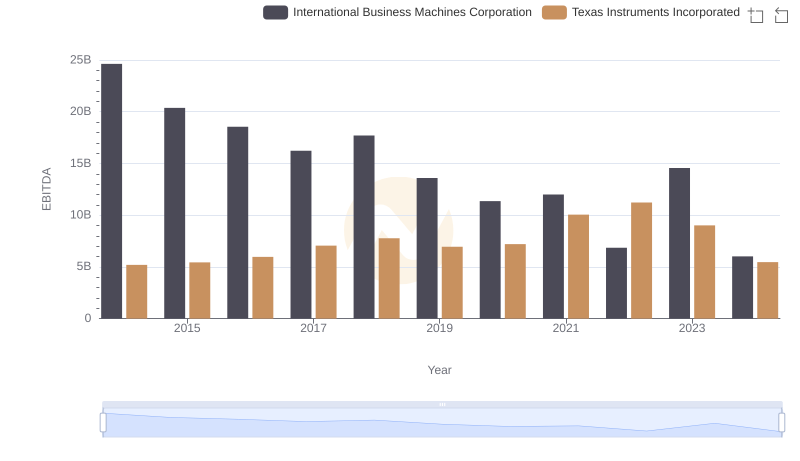
EBITDA Performance Review: International Business Machines Corporation vs Texas Instruments Incorporated