| __timestamp | International Business Machines Corporation | Palo Alto Networks, Inc. |
|---|---|---|
| Wednesday, January 1, 2014 | 92793000000 | 598179000 |
| Thursday, January 1, 2015 | 81742000000 | 928052000 |
| Friday, January 1, 2016 | 79920000000 | 1378500000 |
| Sunday, January 1, 2017 | 79139000000 | 1761600000 |
| Monday, January 1, 2018 | 79591000000 | 2273100000 |
| Tuesday, January 1, 2019 | 57714000000 | 2899600000 |
| Wednesday, January 1, 2020 | 55179000000 | 3408400000 |
| Friday, January 1, 2021 | 57351000000 | 4256100000 |
| Saturday, January 1, 2022 | 60530000000 | 5501500000 |
| Sunday, January 1, 2023 | 61860000000 | 6892700000 |
| Monday, January 1, 2024 | 62753000000 | 8027500000 |
Data in motion
In the ever-evolving tech landscape, the revenue trajectories of International Business Machines Corporation (IBM) and Palo Alto Networks, Inc. offer a fascinating study. From 2014 to 2024, IBM's revenue has seen a decline of approximately 32%, dropping from $92.8 billion to $62.8 billion. This trend reflects the challenges faced by traditional tech giants in adapting to new market dynamics.
Conversely, Palo Alto Networks has experienced a remarkable growth trajectory, with its revenue surging by over 1,200% from $598 million in 2014 to $8 billion in 2024. This growth underscores the increasing demand for cybersecurity solutions in a digital-first world.
While IBM's revenue dip highlights the need for innovation, Palo Alto Networks' rise showcases the potential of niche tech sectors. As we move forward, these trends emphasize the importance of agility and adaptation in the tech industry.
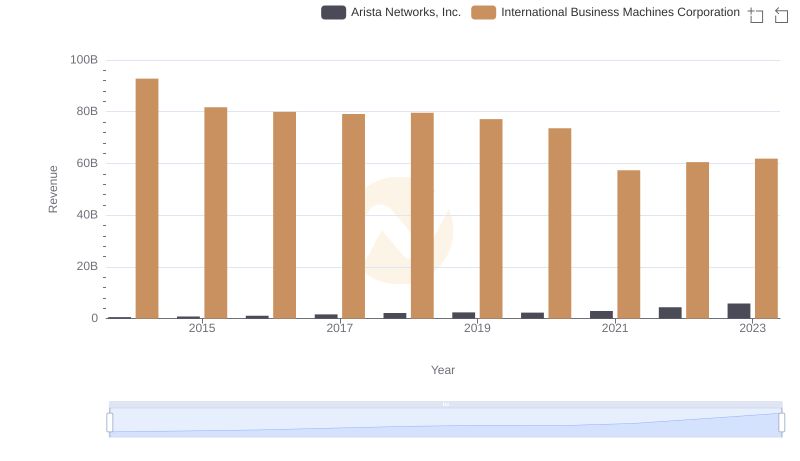
Annual Revenue Comparison: International Business Machines Corporation vs Arista Networks, Inc.
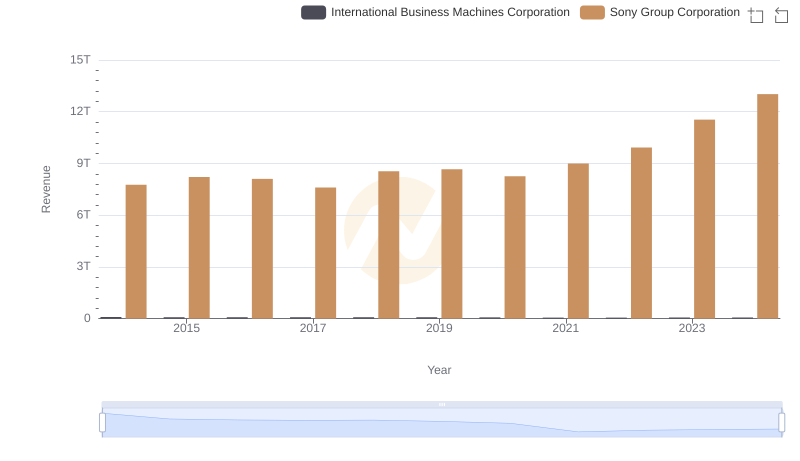
International Business Machines Corporation vs Sony Group Corporation: Annual Revenue Growth Compared
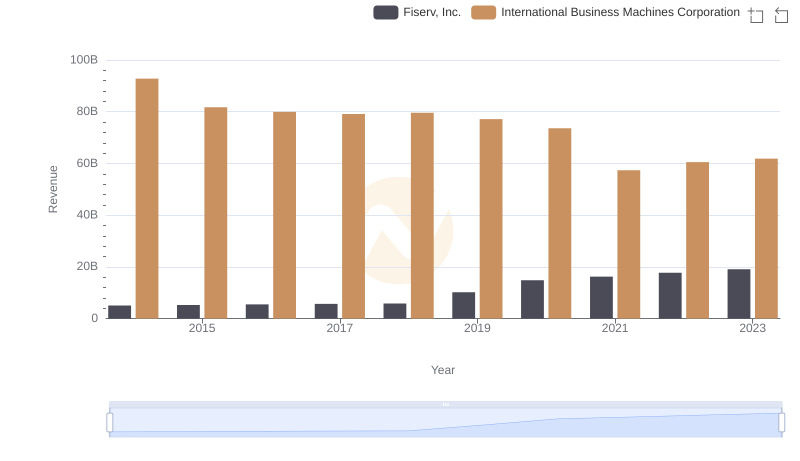
Breaking Down Revenue Trends: International Business Machines Corporation vs Fiserv, Inc.
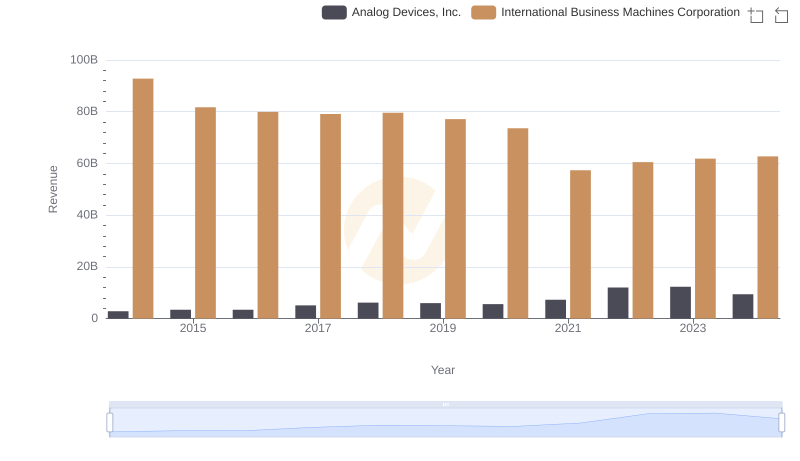
International Business Machines Corporation vs Analog Devices, Inc.: Examining Key Revenue Metrics
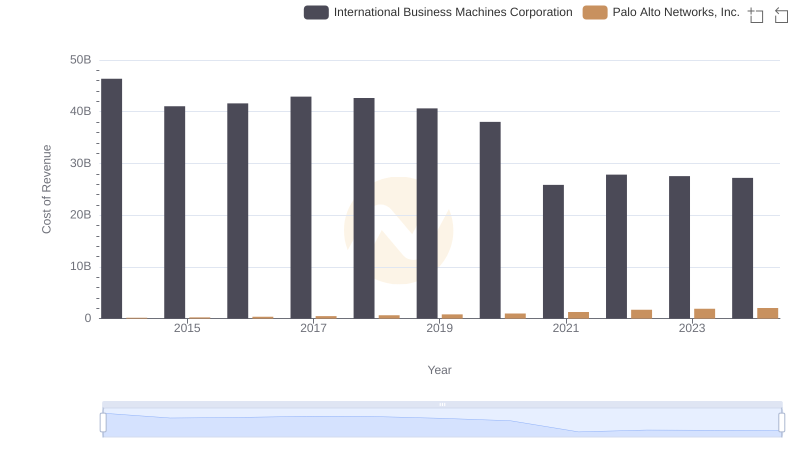
Comparing Cost of Revenue Efficiency: International Business Machines Corporation vs Palo Alto Networks, Inc.
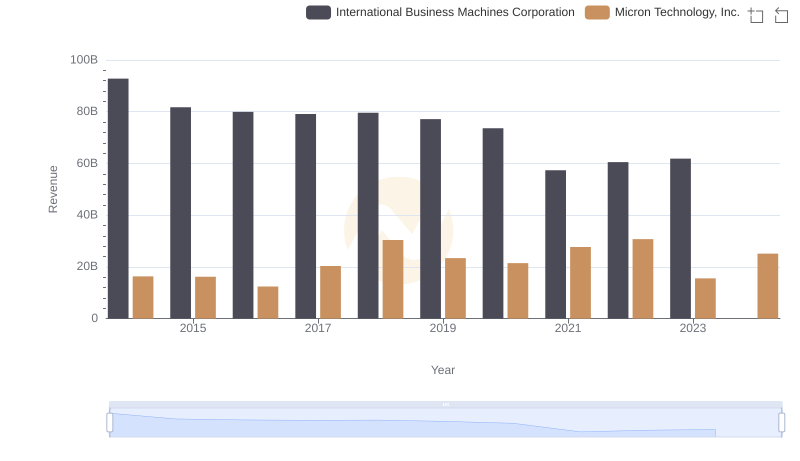
International Business Machines Corporation vs Micron Technology, Inc.: Examining Key Revenue Metrics
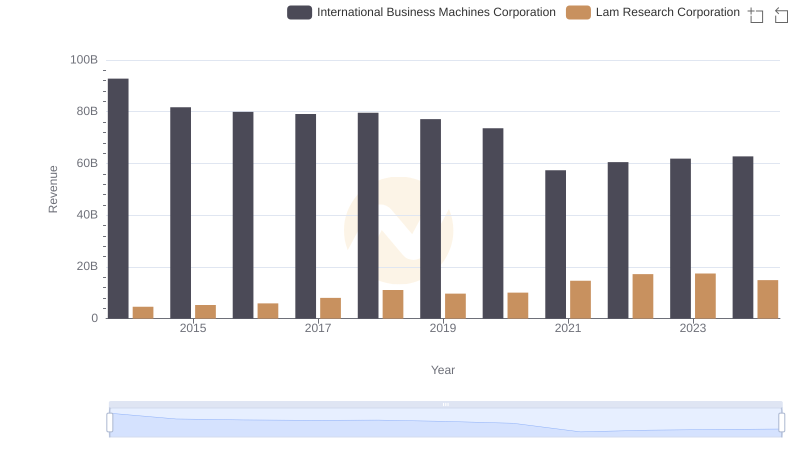
International Business Machines Corporation or Lam Research Corporation: Who Leads in Yearly Revenue?
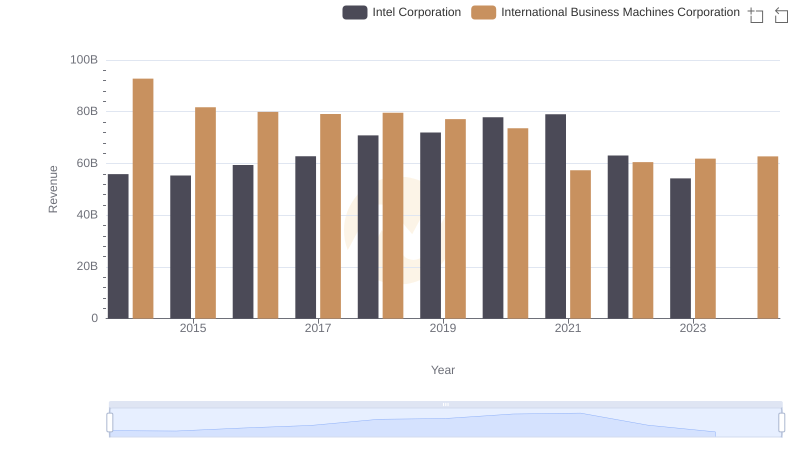
International Business Machines Corporation or Intel Corporation: Who Leads in Yearly Revenue?
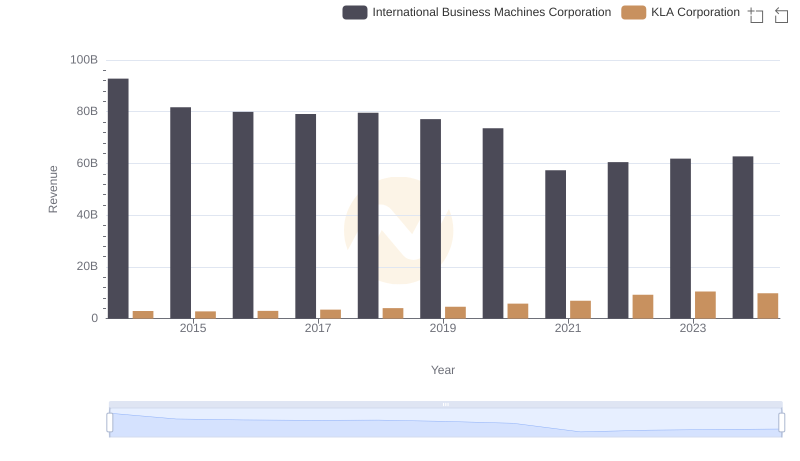
Breaking Down Revenue Trends: International Business Machines Corporation vs KLA Corporation
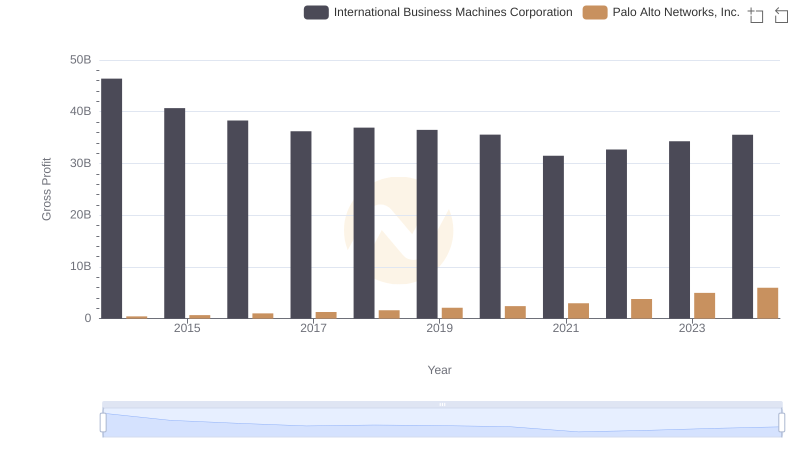
Gross Profit Trends Compared: International Business Machines Corporation vs Palo Alto Networks, Inc.
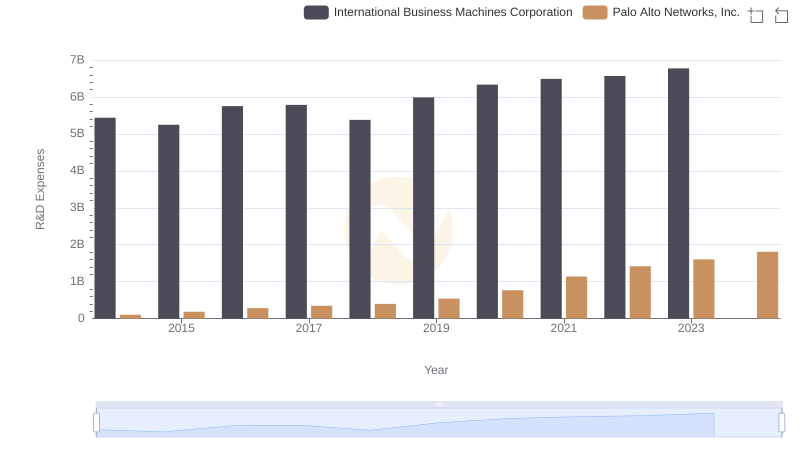
Analyzing R&D Budgets: International Business Machines Corporation vs Palo Alto Networks, Inc.
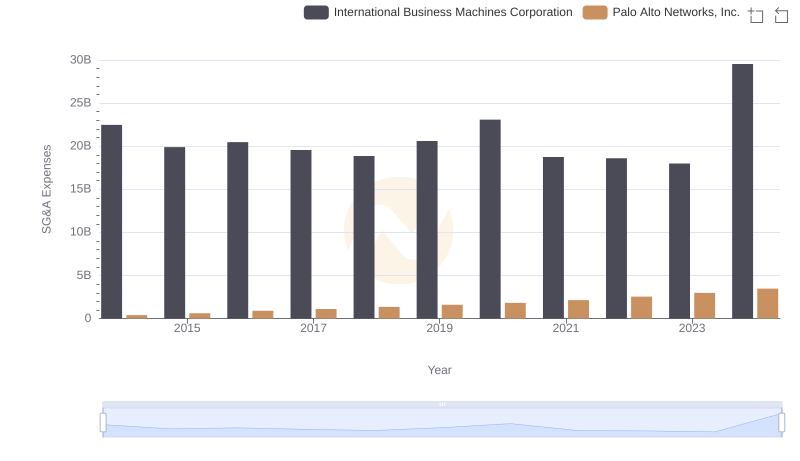
Breaking Down SG&A Expenses: International Business Machines Corporation vs Palo Alto Networks, Inc.