| __timestamp | International Business Machines Corporation | Sony Group Corporation |
|---|---|---|
| Wednesday, January 1, 2014 | 92793000000 | 7767266000000 |
| Thursday, January 1, 2015 | 81742000000 | 8215880000000 |
| Friday, January 1, 2016 | 79920000000 | 8105712000000 |
| Sunday, January 1, 2017 | 79139000000 | 7603250000000 |
| Monday, January 1, 2018 | 79591000000 | 8543982000000 |
| Tuesday, January 1, 2019 | 57714000000 | 8665687000000 |
| Wednesday, January 1, 2020 | 55179000000 | 8259885000000 |
| Friday, January 1, 2021 | 57351000000 | 8999360000000 |
| Saturday, January 1, 2022 | 60530000000 | 9921513000000 |
| Sunday, January 1, 2023 | 61860000000 | 11539837000000 |
| Monday, January 1, 2024 | 62753000000 | 13020768000000 |
Unlocking the unknown
In the ever-evolving landscape of global technology and entertainment, International Business Machines Corporation (IBM) and Sony Group Corporation stand as titans. Over the past decade, these two companies have showcased contrasting revenue trajectories. From 2014 to 2024, IBM's revenue has seen a decline of approximately 32%, dropping from $92.8 billion to $62.8 billion. In stark contrast, Sony's revenue has surged by nearly 68%, climbing from $7.8 trillion to $13 trillion.
IBM's revenue decline reflects its strategic pivot towards cloud computing and AI, moving away from traditional hardware and services. This transition, while promising for future growth, has impacted short-term revenue.
Sony's impressive growth is driven by its diversified portfolio, including gaming, electronics, and entertainment. The company's ability to adapt and innovate has positioned it as a leader in the global market.
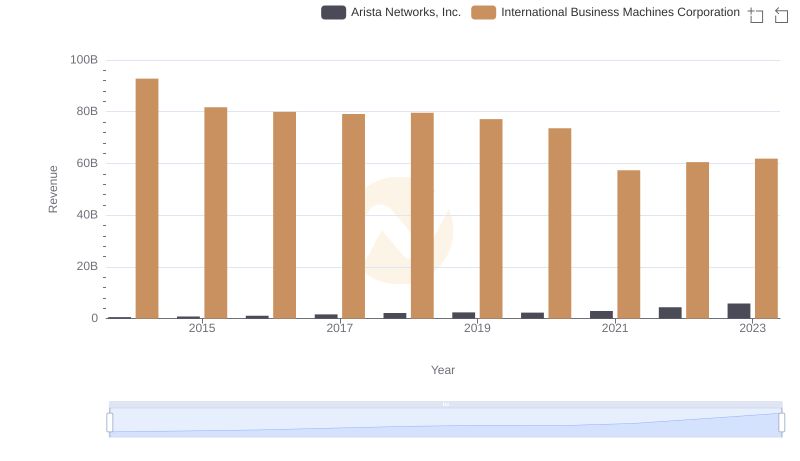
Annual Revenue Comparison: International Business Machines Corporation vs Arista Networks, Inc.
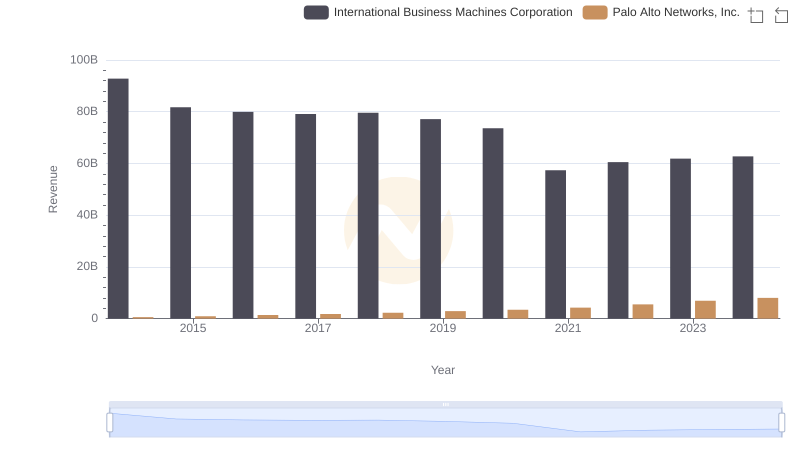
Revenue Insights: International Business Machines Corporation and Palo Alto Networks, Inc. Performance Compared
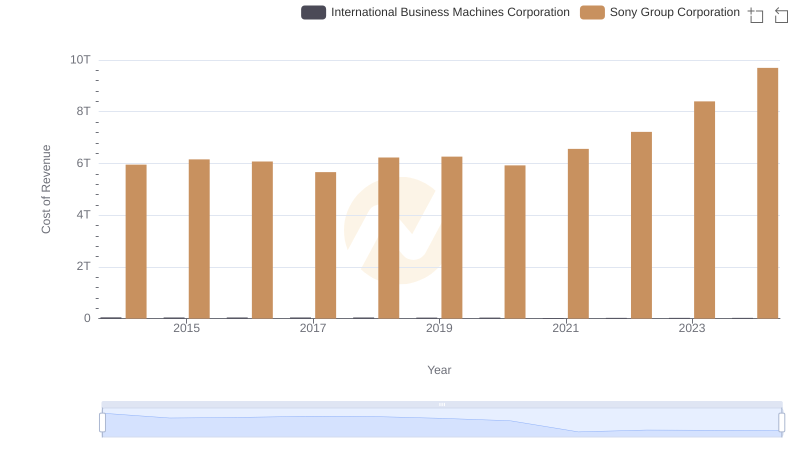
Cost of Revenue: Key Insights for International Business Machines Corporation and Sony Group Corporation
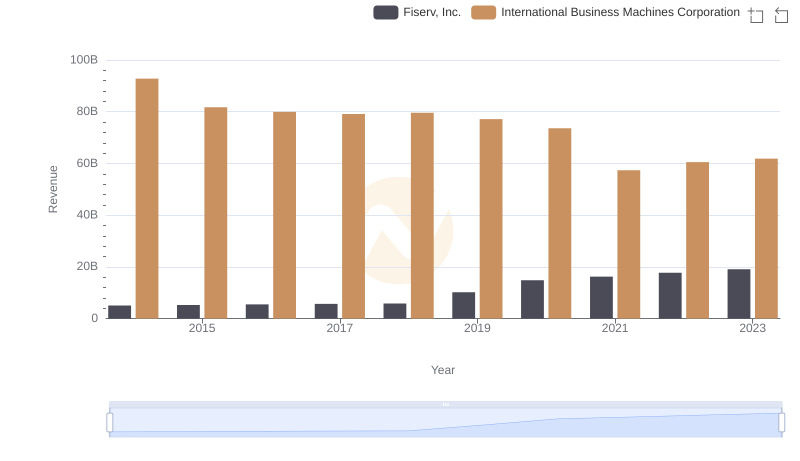
Breaking Down Revenue Trends: International Business Machines Corporation vs Fiserv, Inc.
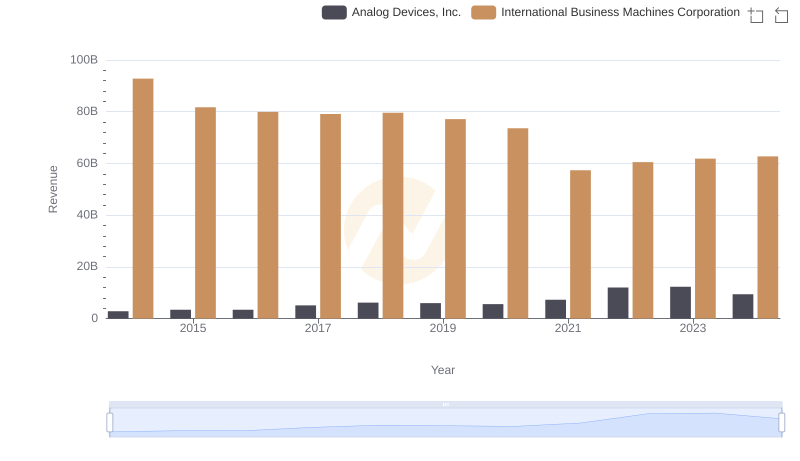
International Business Machines Corporation vs Analog Devices, Inc.: Examining Key Revenue Metrics
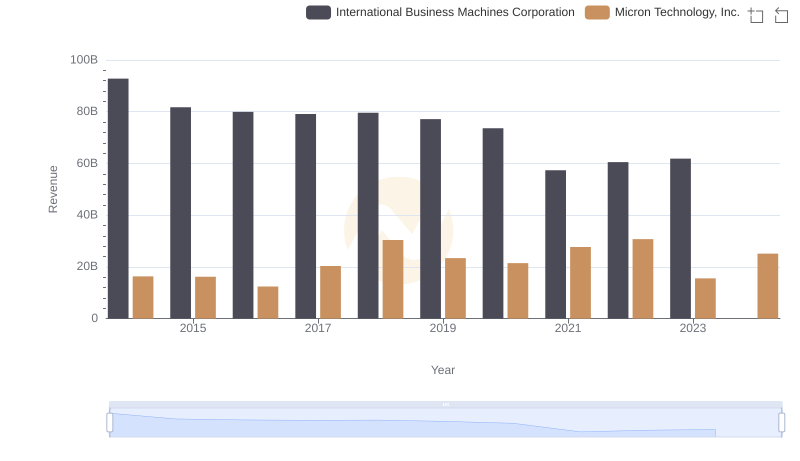
International Business Machines Corporation vs Micron Technology, Inc.: Examining Key Revenue Metrics
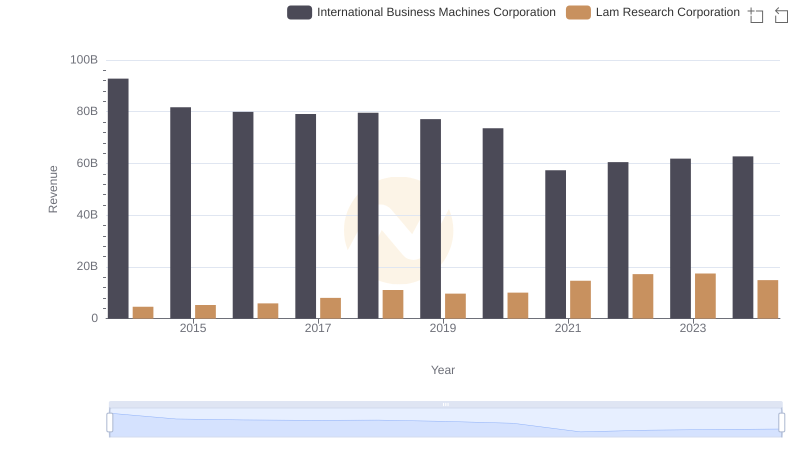
International Business Machines Corporation or Lam Research Corporation: Who Leads in Yearly Revenue?
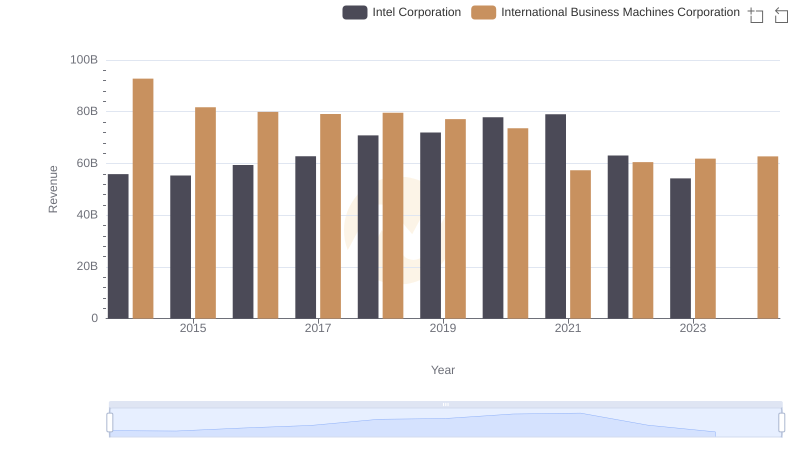
International Business Machines Corporation or Intel Corporation: Who Leads in Yearly Revenue?
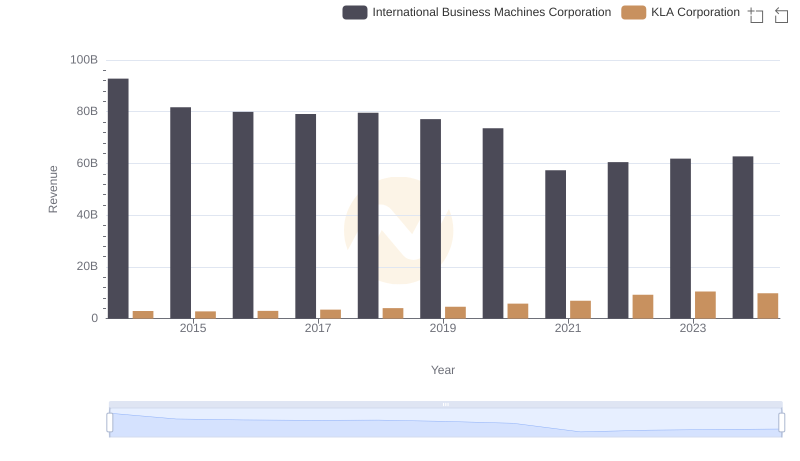
Breaking Down Revenue Trends: International Business Machines Corporation vs KLA Corporation
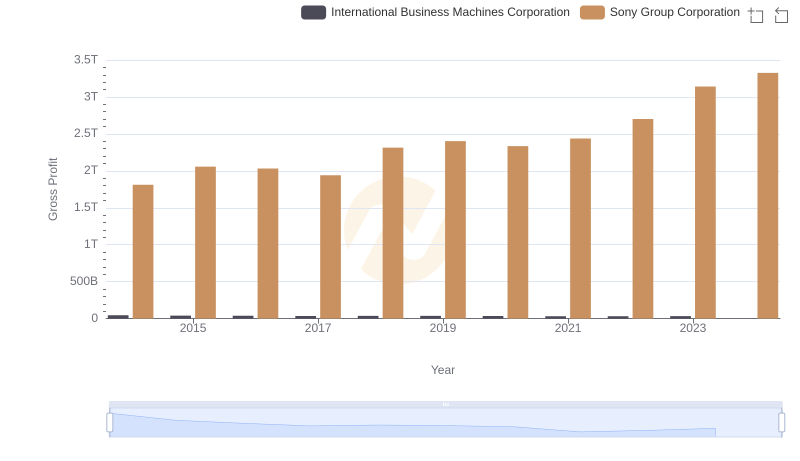
Who Generates Higher Gross Profit? International Business Machines Corporation or Sony Group Corporation
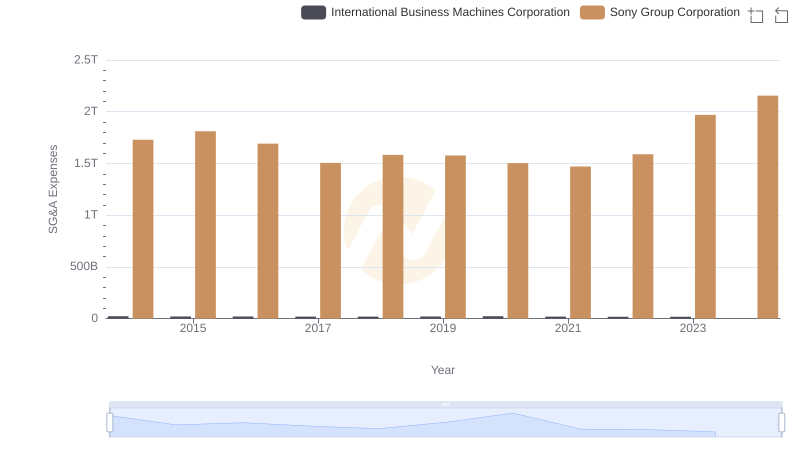
Who Optimizes SG&A Costs Better? International Business Machines Corporation or Sony Group Corporation