| __timestamp | Carlisle Companies Incorporated | United Airlines Holdings, Inc. |
|---|---|---|
| Wednesday, January 1, 2014 | 2384500000 | 29569000000 |
| Thursday, January 1, 2015 | 2536500000 | 25952000000 |
| Friday, January 1, 2016 | 2518100000 | 24856000000 |
| Sunday, January 1, 2017 | 2941900000 | 27056000000 |
| Monday, January 1, 2018 | 3304800000 | 30165000000 |
| Tuesday, January 1, 2019 | 3439900000 | 30786000000 |
| Wednesday, January 1, 2020 | 2832500000 | 20385000000 |
| Friday, January 1, 2021 | 3495600000 | 23913000000 |
| Saturday, January 1, 2022 | 4434500000 | 34315000000 |
| Sunday, January 1, 2023 | 3042900000 | 38518000000 |
| Monday, January 1, 2024 | 3115900000 | 37643000000 |
Unleashing the power of data
In the ever-evolving landscape of corporate finance, understanding the cost of revenue is crucial for evaluating a company's efficiency and profitability. This analysis delves into the cost of revenue trends for United Airlines Holdings, Inc. and Carlisle Companies Incorporated from 2014 to 2023.
United Airlines, a titan in the aviation industry, has seen its cost of revenue fluctuate significantly over the years. Notably, in 2020, the cost plummeted to approximately 71% of its 2019 value, reflecting the pandemic's impact. However, by 2023, it rebounded to nearly 130% of its 2020 level, showcasing resilience and recovery.
Conversely, Carlisle Companies, a diversified manufacturer, experienced a more stable trajectory. From 2014 to 2023, its cost of revenue increased by about 28%, indicating steady growth and expansion. The peak in 2022, at 44% above the 2014 level, underscores its strategic advancements.
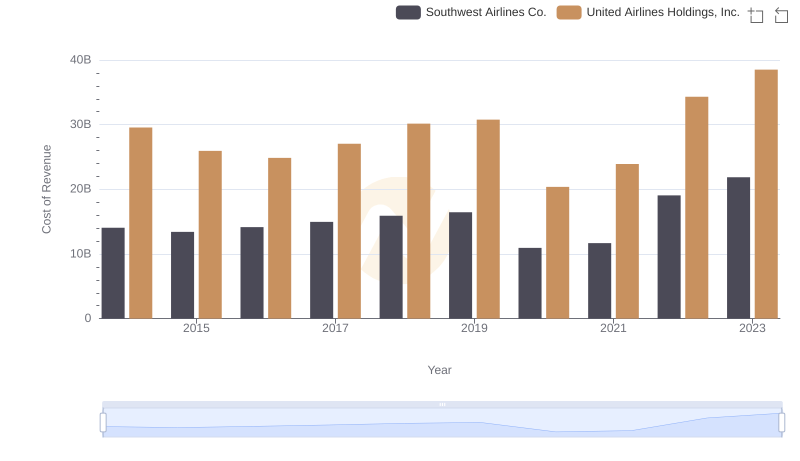
Cost of Revenue Trends: United Airlines Holdings, Inc. vs Southwest Airlines Co.
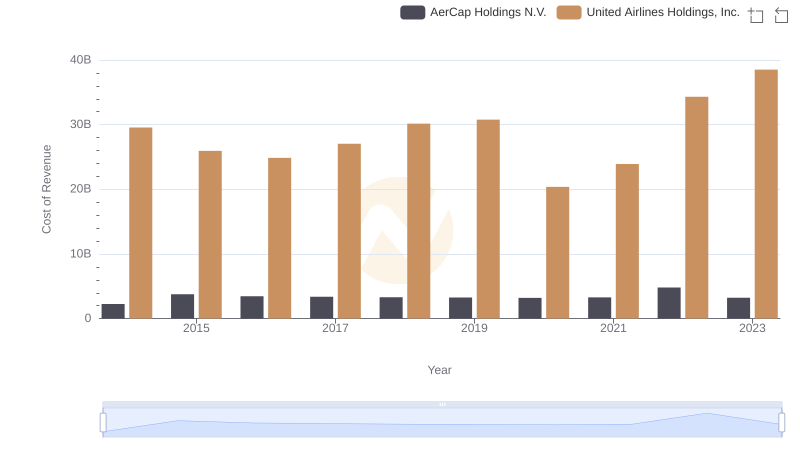
Analyzing Cost of Revenue: United Airlines Holdings, Inc. and AerCap Holdings N.V.
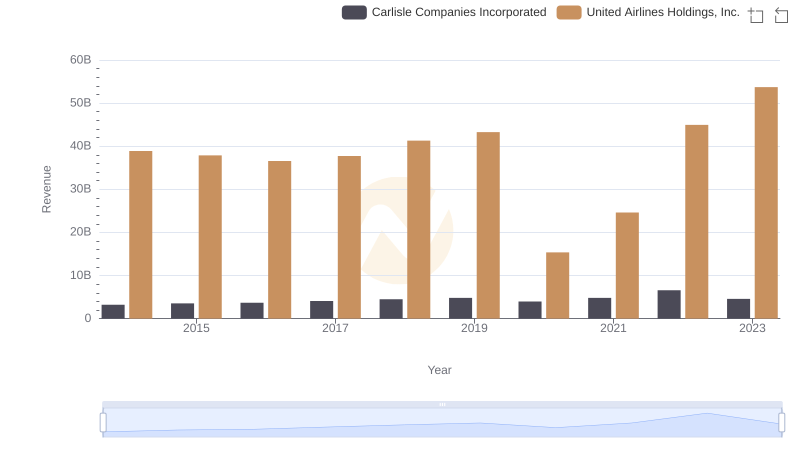
United Airlines Holdings, Inc. or Carlisle Companies Incorporated: Who Leads in Yearly Revenue?
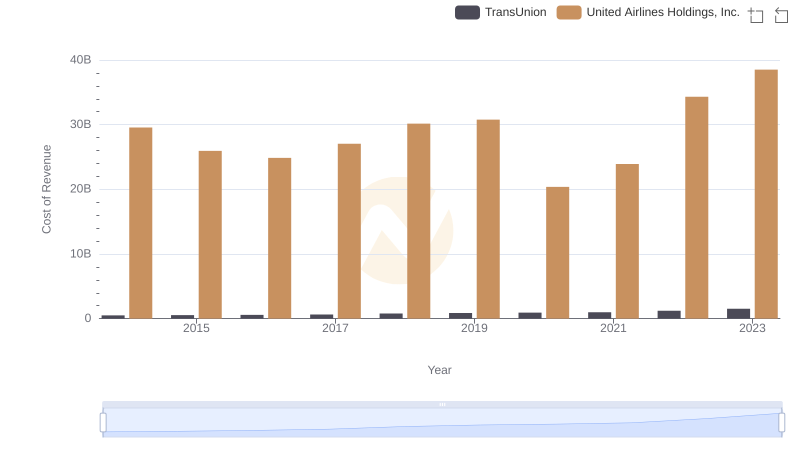
United Airlines Holdings, Inc. vs TransUnion: Efficiency in Cost of Revenue Explored
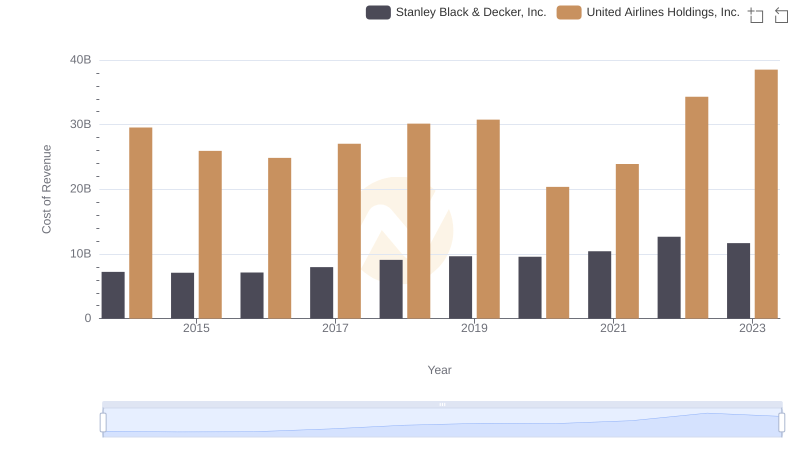
Comparing Cost of Revenue Efficiency: United Airlines Holdings, Inc. vs Stanley Black & Decker, Inc.
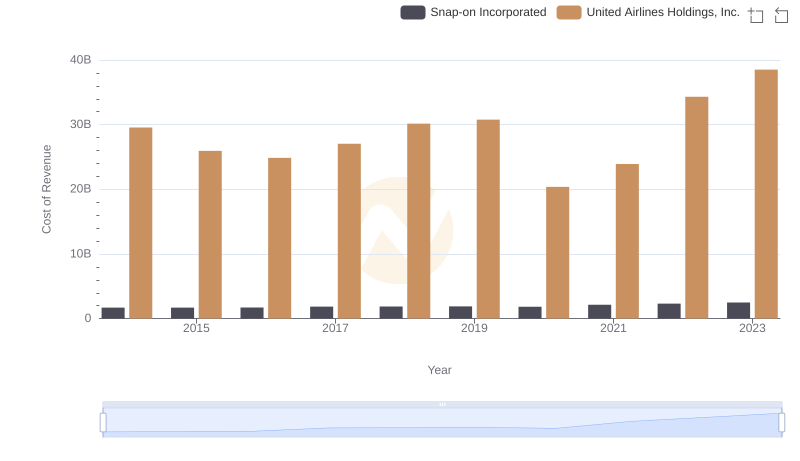
United Airlines Holdings, Inc. vs Snap-on Incorporated: Efficiency in Cost of Revenue Explored

Cost of Revenue Trends: United Airlines Holdings, Inc. vs Masco Corporation
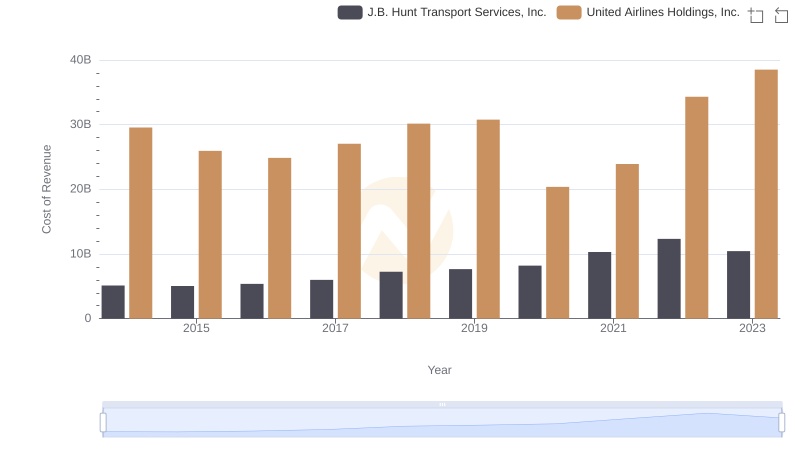
Cost of Revenue Trends: United Airlines Holdings, Inc. vs J.B. Hunt Transport Services, Inc.
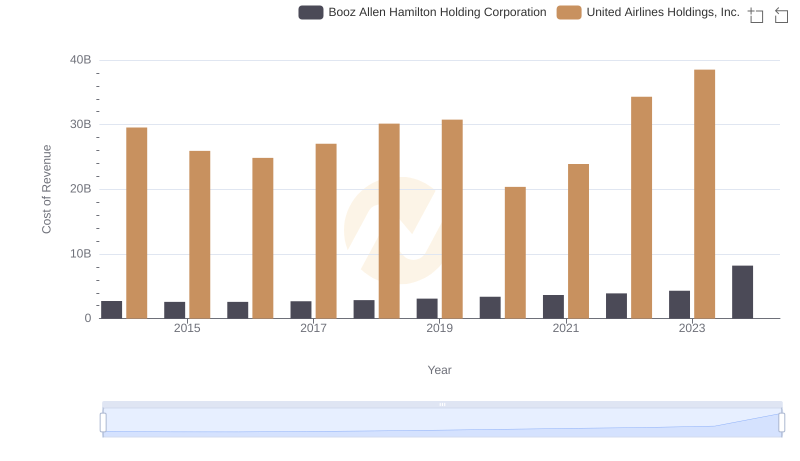
Cost of Revenue Trends: United Airlines Holdings, Inc. vs Booz Allen Hamilton Holding Corporation
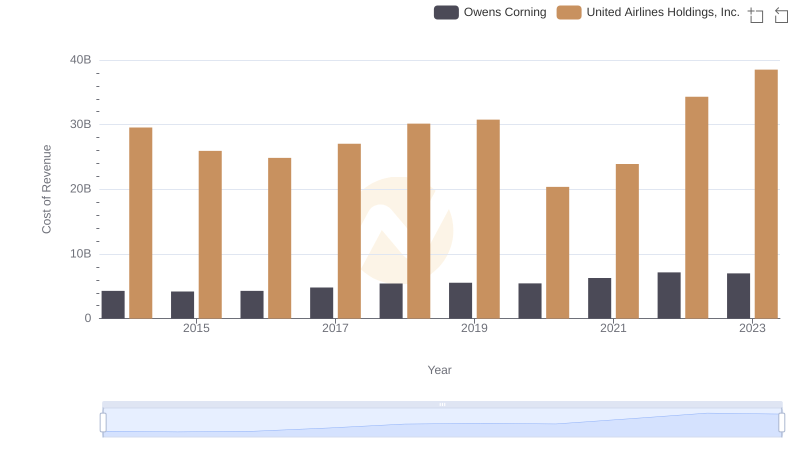
Cost of Revenue: Key Insights for United Airlines Holdings, Inc. and Owens Corning
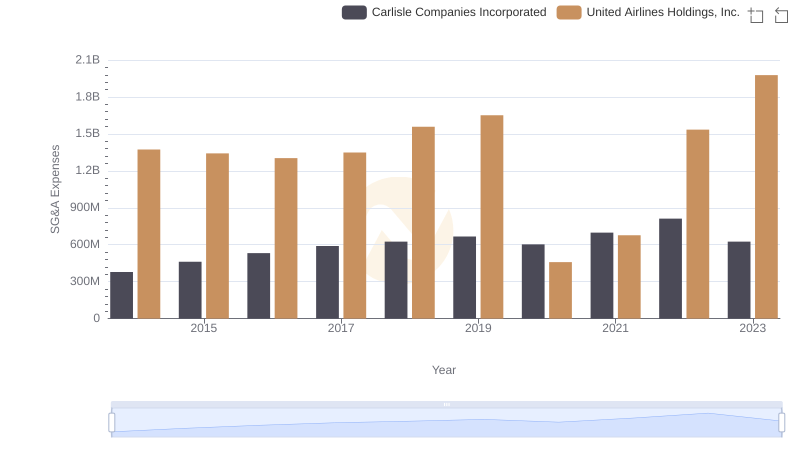
Selling, General, and Administrative Costs: United Airlines Holdings, Inc. vs Carlisle Companies Incorporated