| __timestamp | Booz Allen Hamilton Holding Corporation | United Airlines Holdings, Inc. |
|---|---|---|
| Wednesday, January 1, 2014 | 2716113000 | 29569000000 |
| Thursday, January 1, 2015 | 2593849000 | 25952000000 |
| Friday, January 1, 2016 | 2580026000 | 24856000000 |
| Sunday, January 1, 2017 | 2691982000 | 27056000000 |
| Monday, January 1, 2018 | 2867103000 | 30165000000 |
| Tuesday, January 1, 2019 | 3100466000 | 30786000000 |
| Wednesday, January 1, 2020 | 3379180000 | 20385000000 |
| Friday, January 1, 2021 | 3657530000 | 23913000000 |
| Saturday, January 1, 2022 | 3899622000 | 34315000000 |
| Sunday, January 1, 2023 | 4304810000 | 38518000000 |
| Monday, January 1, 2024 | 8202847000 | 37643000000 |
Infusing magic into the data realm
In the ever-evolving landscape of corporate finance, understanding cost structures is crucial. This analysis juxtaposes the cost of revenue trends for United Airlines Holdings, Inc. and Booz Allen Hamilton Holding Corporation from 2014 to 2023. United Airlines, a titan in the aviation industry, saw its cost of revenue fluctuate, peaking in 2023 with a 31% increase from its 2020 low. Meanwhile, Booz Allen Hamilton, a leader in management consulting, experienced a steady rise, culminating in a 52% increase over the same period.
These trends underscore the distinct challenges and opportunities faced by companies in different sectors, offering valuable insights for investors and industry analysts.
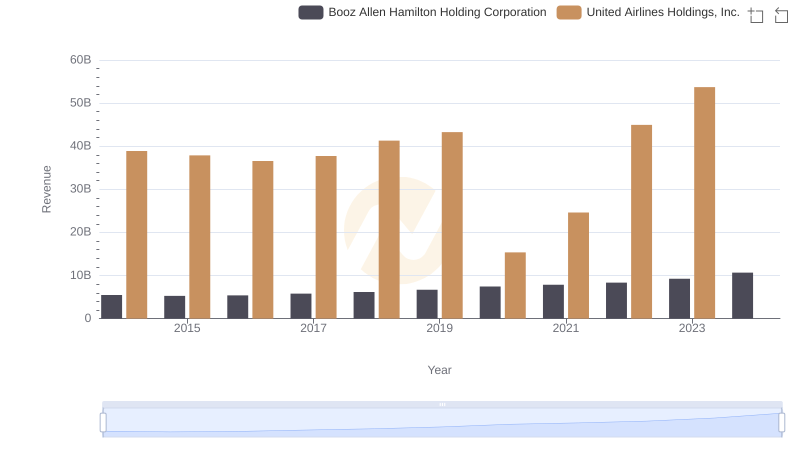
Who Generates More Revenue? United Airlines Holdings, Inc. or Booz Allen Hamilton Holding Corporation
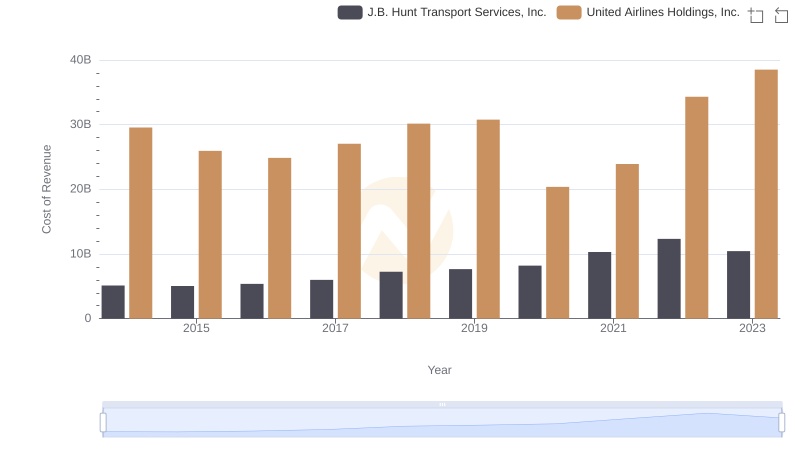
Cost of Revenue Trends: United Airlines Holdings, Inc. vs J.B. Hunt Transport Services, Inc.
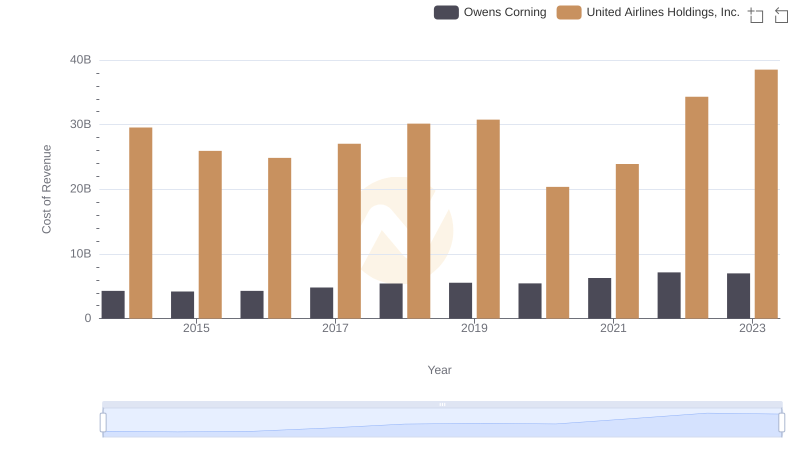
Cost of Revenue: Key Insights for United Airlines Holdings, Inc. and Owens Corning
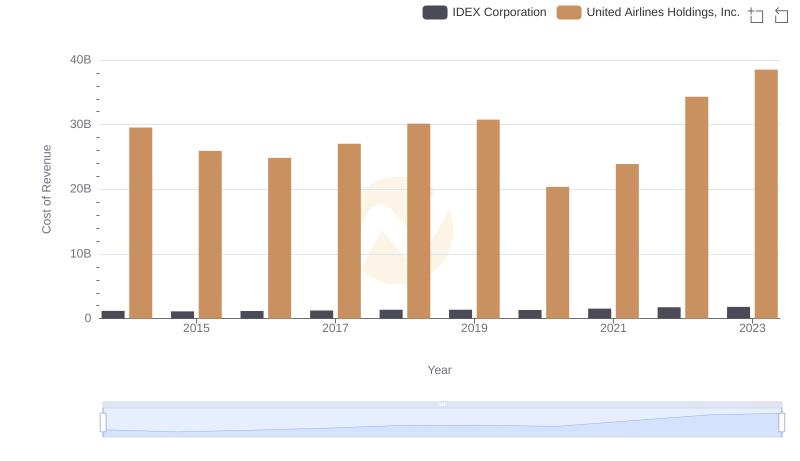
Cost of Revenue Trends: United Airlines Holdings, Inc. vs IDEX Corporation
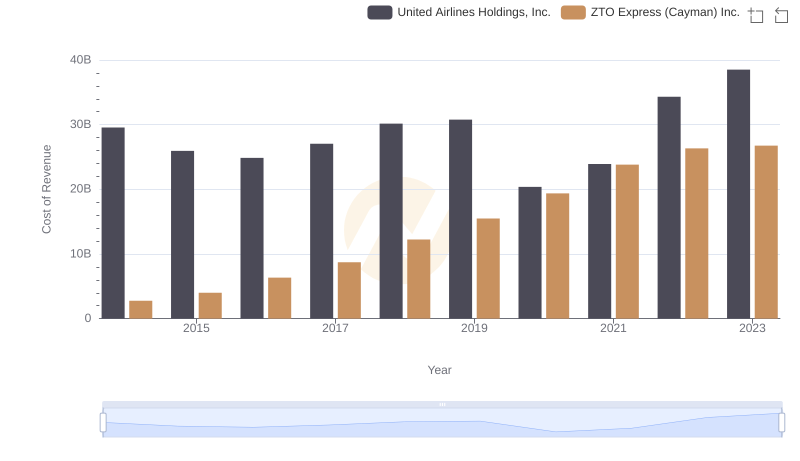
Cost Insights: Breaking Down United Airlines Holdings, Inc. and ZTO Express (Cayman) Inc.'s Expenses
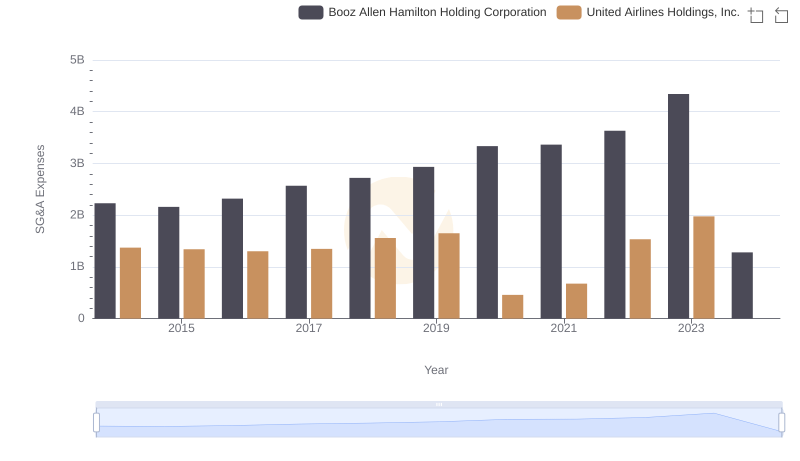
United Airlines Holdings, Inc. or Booz Allen Hamilton Holding Corporation: Who Manages SG&A Costs Better?